When writing heap exploits it’s necessary to be able to view the heap state during debugging. As part of our work on TCMalloc, Agustin and I have written up some heap scripts for Immunity Debugger and GDB that make the process of tracking what TCMalloc is up to quite easy. There are quite a few scripts that do similar things for ID and different heap implementations so in this post I’m going to focus on the GDB side of things. Recent versions of GDB contain an embedded Python interpreter that provides easy access to the internals of an application being debugged. Being able to write scripts in Python to automate debugging tasks is really useful and hopefully the GDB guys will maintain the project.
The scripts I will be discussing in this post can be found here. Copy the gdbinit file your home directory or the one where you will be launching gdb from and rename it to .gdbinit. Modify the pyscripts_dir variable to point to the directory where you extracted the scripts. To load the commands run source /path/to/scripts/dump_free_list.py or source /path/to/scripts/search_free_lists.py. This will make the commands dump_free_list and search_free_lists available within gdb.
The data structures used by TCMalloc are relatively simple so the scripts have little to do besides reading memory and walking lists. Each thread in an application using TCMalloc has its own TCMalloc_ThreadCache object which contains information on the FreeLists for that specific thread. The FreeLists themselves are ThreadCache_FreeList objects, each of which contains a list_ attribute that points to the head of a singly linked list of free chunks. We can access the TLS for a given thread via pthread_self() in GDB and find the ThreadCache_FreeList pointer at the offset -4 from there. The file tcmalloc.py contains abstractions for the ThreadCache_FreeList and TCMalloc_ThreadCache structures. In dump_free_lists.py we can see the initialisation of the ThreadCache abstraction via the following code:
 24         tls = gdb.parse_and_eval("pthread_self()")
 25         # threadlocal_heap is at TLS - 4
 26         threadlocal_heap = buf_to_le(
 27             self.cur_proc.read_memory(tls - 4, DWORD_SIZE))
 28
 29         tc = ThreadCache(self.cur_proc, threadlocal_heap)
The ThreadCache instance then provides access to the FreeLists for the current thread through getFreeLists. The size classes that TCMalloc uses to bucket chunks together for allocations less than 32768 in size are generated at run-time. To view them run tcmalloc.py outside of gdb with no arguments.
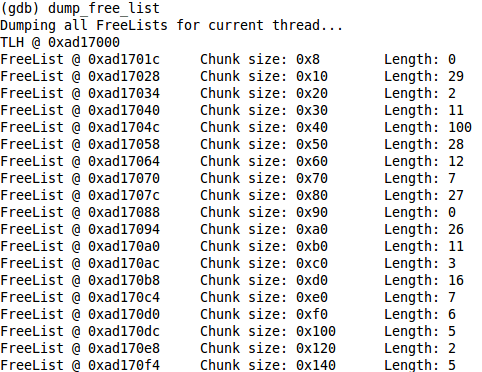
The number of size classes, and hence the number of FreeLists per thread, is dependent a constant that may change between applications embedding TCMalloc. For Chrome it is 61 and hence we have 61 different FreeLists per thread. If we run dump_free_lists within gdb with no arguments it will dump all free lists, their lengths and the chunk size that list is responsible for.

The getFreeLists function will return each of these FreeLists as a FreeList object. This object contains a list_ptr attribute that corresponds to the list_ pointer found in the TCMalloc source for each FreeList. It points to a singly linked list of free chunks that we can iterate over using the getChunks function of a FreeList object.
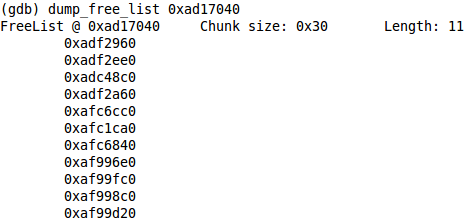
If we run dump_free_lists with one or more space separated addresses it will treat them as pointers to ThreadCache_FreeList structures and dump them accordingly.

The scripts archive also contains the search_free_lists command which will search the FreeLists to see if an address lies within a chunk on any of the FreeLists. After Infiltrate we will release the rest of the scripts for ID and GDB but these should be enough to get you started with TCMalloc and GDBs Python API.

Me gusta.
Very nice! Thank you!
Hi,
Are you going to release the scripts once infiltrate is over?
BTW, are you going to give this talk anywhere else?
Hey,
We’ll probably bundle the scripts with an upcoming release of Immunity Debugger. As for giving the talk elsewhere, we’re busy enough just thinking about Infiltrate at the moment 🙂 We’ll consider it afterwards I guess.