Tracking Down Heap Overflows with rr

Anyone who’s spent time doing vulnerability analysis on C/C++ has had the experience of floundering around in a debugger for hours on end trying to figure out the source of a mysterious crash.

The reason this can be an incredibly time consuming and frustrating process is simple: memory corruption is often quite subtle in its effect. The fact that corruption has occurred may not actually become apparent until far later in the program’s execution, when all trace of the buggy function is gone from the call-stack. Along with that, due to randomisation of various things, such as memory layout and allocation patterns, the same root cause can manifest in a variety of different ways across multiple runs.

For example, lets say we’re analysing an interpreter, e.g. php, and the following occurs: an API call triggers a function containing a bug, and a write to buffer X overflows into the memory occupied by object Y, smashing some pointers internal to Y.  The API call returns, the interpreted program eventually ends and the interpreter begins to shutdown. During the shutdown process it notifies Y, which tries to use its (now corrupted) internal pointers and crashes. By the time the crash occurs, there is no trace of the buggy API call on the call-stack, nor is there any apparent link in the source code between the contents of buffer X and the corrupted internal pointer of object Y.

The above scenario isn’t limited to buffer overflows on the heap. Use-after-frees and other memory life-time management issues can have similar effects. At a high level the question we want to answer when debugging such situations is straightforward ‘Where did the data that corrupted this location get written?’. Taint tracking solutions attempt to solve this problem by tracking data forwards from a taint source. For various reasons, all existing implementations tend to be limited to two of  fast, accurate or detailed, and all three are often required for a trace of tainted data to be useful.

This brings me to rr, a tool developed by Robert O’Callahan of Mozilla. The project page is here, and this video is a good introduction to the tool. rr can do really fast record and replay, but on top of that it can also do really fast reverse execution. During replay, the user interface provided is gdb‘s, and thus you effectively get your standard debugger interface but with a guarantee that repeated runs will be identical, as well as the ability to execute in reverse. The key to solving our heap overflow problem is that not only can you execute in reverse, but that, during reverse execution, watch points (and normal breakpoints) still function. In other words, if we want to know where some data in memory came from, we can set a watch point on it, execute reverse-continue and the program will execute in reverse until the point where the data was written [1].

I hope the following example highlights how useful this capability can be.

The php interpreter  recently had a potentially remotely exploitable issue due to a flaw in the libgd library, which it bundles. The libgd issue was assigned CVE-2016-3074 and the PHP bug tracker entry is here. The reporter rather helpfully included a PoC exploit, which you can find at the previous link, that is intended to spawn a reverse shell. This PoC is a useful starting point for a ‘real’ exploit, but is pretty much ‘hit and hope’ in terms of reliability: it sprays data after a overflowed buffer, seemingly in the hope of corrupting a function pointer called before the corruption causes the process to die for some other reason [2]. For fun I decided to build a more reliable exploit around the primitives offered by the bug, and the first step of this was figuring out exactly why the existing PoC was failing.

When I first ran the PoC, mod_php died in a strlen function call due to being passed a pointer to an unmapped region of memory. The backtrace at that point (in normal gdb) looked as follows:

[root@localhost ~]# gdb --pid=1963
GNU gdb (GDB) Fedora 7.10.1-31.fc23
0x00007f7ca5dc6a68 in accept4 (fd=4, addr=addr@entry=..., addr_len=addr_len@entry=0x7ffe3580e2e0, flags=flags@entry=524288) at ../sysdeps/unix/sysv/linux/accept4.c:40
40      return SYSCALL_CANCEL (accept4, fd, addr.__sockaddr__, addr_len, flags);
(gdb) c
Continuing.

Program received signal SIGSEGV, Segmentation fault.
strlen () at ../sysdeps/x86_64/strlen.S:106
106        movdqu    (%rax), %xmm12
(gdb) bt
#0  strlen () at ../sysdeps/x86_64/strlen.S:106
#1  0x00007f7ca312aad9 in format_converter (odp=0x7ffe3580bff0, fmt=0x7f7ca37dca49 "s(%d) :  Freeing 0x%.8lX (%zu bytes), script=%s\n", ap=0x7ffe3580c040)
    at php-7.0.5-debug/main/snprintf.c:993
#2  0x00007f7ca312b40c in strx_printv (ccp=0x7ffe3580c05c, buf=0x7ffe3580c380 "[Thu May 26 12:32:29 2016]  Script:  '/var/www/html/upload.php'\n", len=512, format=0x7f7ca37dca48 "%s(%d) :  Freeing 0x%.8lX (%zu bytes), script=%s\n", 
    ap=0x7ffe3580c040) at php-7.0.5-debug/main/snprintf.c:1248
#3  0x00007f7ca312b645 in ap_php_snprintf (buf=0x7ffe3580c380 "[Thu May 26 12:32:29 2016]  Script:  '/var/www/html/upload.php'\n", len=512, format=0x7f7ca37dca48 "%s(%d) :  Freeing 0x%.8lX (%zu bytes), script=%s\n")
    at php-7.0.5-debug/main/snprintf.c:1293
#4  0x00007f7ca3126483 in php_message_handler_for_zend (message=4, data=0x7ffe3580d410) at php-7.0.5-debug/main/main.c:1444
#5  0x00007f7ca31b5523 in zend_message_dispatcher (message=4, data=0x7ffe3580d410) at php-7.0.5-debug/Zend/zend.c:998
#6  0x00007f7ca3182bef in zend_mm_check_leaks (heap=0x7f7c96a00040) at php-7.0.5-debug/Zend/zend_alloc.c:2129
#7  0x00007f7ca3182f2e in zend_mm_shutdown (heap=0x7f7c96a00040, full=0, silent=0) at php-7.0.5-debug/Zend/zend_alloc.c:2201
#8  0x00007f7ca3183d1b in shutdown_memory_manager (silent=0, full_shutdown=0) at php-7.0.5-debug/Zend/zend_alloc.c:2637
#9  0x00007f7ca3127255 in php_request_shutdown (dummy=0x0) at php-7.0.5-debug/main/main.c:1849
#10 0x00007f7ca3274e8a in php_apache_request_dtor (r=0x55a587a49780) at php-7.0.5-debug/sapi/apache2handler/sapi_apache2.c:518
...

Again using normal gdb we can quickly figure out that the issue is that strlen is passed a pointer to unmapped memory, and that the source of that pointer is the php_message_handler_for_zend function (frame 4 above). e.g.:

(gdb) f 1
#1 0x00007f7ca312aad9 in format_converter (odp=0x7ffe3580bff0, fmt=0x7f7ca37dca49 "s(%d) : Freeing 0x%.8lX (%zu bytes), script=%s\n", ap=0x7ffe3580c040)
 at php-7.0.5-debug/main/snprintf.c:993
993 s_len = strlen(s);
(gdb) l
988 
989 case 's':
990 case 'v':
991 s = va_arg(ap, char *);
992 if (s != NULL) {
993     s_len = strlen(s);
994     if (adjust_precision && precision < s_len) {
995         s_len = precision;
996     }
997 } else {
(gdb) p/x s
$1 = 0xa8bc37
(gdb) x/x s
0xa8bc37: Cannot access memory at address 0xa8bc37

This tells us that the argument to strlen is a vararg. We can figure out where that came from easily enough:

(gdb) f 2
#2 0x00007f7ca312b40c in strx_printv (ccp=0x7ffe3580c05c, buf=0x7ffe3580c380 "[Thu May 26 12:32:29 2016] Script: '/var/www/html/upload.php'\n", len=512, format=0x7f7ca37dca48 "%s(%d) : Freeing 0x%.8lX (%zu bytes), script=%s\n", 
 ap=0x7ffe3580c040) at php-7.0.5-debug/main/snprintf.c:1248
1248 cc = format_converter(&od, format, ap);
(gdb) f 3
#3 0x00007f7ca312b645 in ap_php_snprintf (buf=0x7ffe3580c380 "[Thu May 26 12:32:29 2016] Script: '/var/www/html/upload.php'\n", len=512, format=0x7f7ca37dca48 "%s(%d) : Freeing 0x%.8lX (%zu bytes), script=%s\n")
 at php-7.0.5-debug/main/snprintf.c:1293
1293 strx_printv(&cc, buf, len, format, ap);
(gdb) f 4
#4 0x00007f7ca3126483 in php_message_handler_for_zend (message=4, data=0x7ffe3580d410) at php-7.0.5-debug/main/main.c:1444
1444 snprintf(memory_leak_buf, 512, "%s(%d) : Freeing 0x%.8lX (%zu bytes), script=%s\n", t->filename, t->lineno, (zend_uintptr_t)t->addr, t->size, SAFE_FILENAME(SG(request_info).path_translated));
(gdb) p/x t->filename
$2 = 0xa8bc37

From the above code we can see that php_message_handler_for_zend is where the corrupted pointer is read and utilised as an argument to snprintf, while ap_php_snprintf and strx_printv just pass through the ap variable, from which the invalid pointer is eventually extracted and used in format_converter.

We are now back at the problem I stated in the beginning: We have a corrupted memory location, &(t->filename),and we want to know the source of that corruption. In a ‘normal’ dataflow tracking scenario we could read the source code and find locations that write to &(t->filename) and work from there. When a variable is influenced due to a heap overflow of an unrelated memory buffer that is no longer an option. Once corruption has occurred we’ve traversed from the state-space which is apparent by inspecting the source to the state-space of a ‘weird machine’ which, among other things, is dependent on memory layout.

Fortunately, ‘What is the source of data at memory location x?‘ is exactly the kind of question that rr can help us answer. We begin by starting the target (apache in this case) under rr, and triggering the crash. This is simply achieved via rr httpd -X. We can then replay the session up until the crash point as follows:

[root@localhost tmp]# rr replay
GNU gdb (GDB) Fedora 7.10.1-31.fc23
0x00007f8710739c80 in _start () from /lib64/ld-linux-x86-64.so.2
(rr) c
Continuing.
AH00558: httpd: Could not reliably determine the server's fully qualified domain name, using localhost.localdomain. Set the 'ServerName' directive globally to suppress this message
[New Thread 57236.57239]

Program received signal SIGSEGV, Segmentation fault.
strlen () at ../sysdeps/x86_64/strlen.S:106
106        movdqu    (%rax), %xmm12

From our previous analysis we know the data which we wish to know the source of is the memory backing t->filename in frame 4, so we can switch to that frame and add a watch point:

(rr) f 4
#4  0x00007f870c079483 in php_message_handler_for_zend (message=4, data=0x7ffd14c702c0) at php-7.0.5-debug/main/main.c:1444
1444                        snprintf(memory_leak_buf, 512, "%s(%d) :  Freeing 0x%.8lX (%zu bytes), script=%s\n", t->filename, t->lineno, (zend_uintptr_t)t->addr, t->size, SAFE_FILENAME(SG(request_info).path_translated));
(rr) p &(t->filename)
$1 = (const char **) 0x7ffd14c702d0
(rr) watch -l t->filename
Hardware watchpoint 1: -location t->filename
(rr) reverse-continue 
Continuing.

Program received signal SIGSEGV, Segmentation fault.
strlen () at ../sysdeps/x86_64/strlen.S:106
106        movdqu    (%rax), %xmm12
(rr) reverse-continue 
Continuing.
Hardware watchpoint 1: -location t->filename

Old value = 0xa8bc37 <error: Cannot access memory at address 0xa8bc37>
New value = 0xff15e8fef2615642 <error: Cannot access memory at address 0xff15e8fef2615642>
0x00007f870c0d5bab in zend_mm_check_leaks (heap=0x7f86ffa00040) at php-7.0.5-debug/Zend/zend_alloc.c:2123
2123                                leak.filename = dbg->filename;
(rr) p &(leak.filename)
$2 = (const char **) 0x7ffd14c702d0
(rr) p/x dbg->filename
$3 = 0xa8bc37

From the above we discover that the write to t->filename (address 0x7ffd14c702d0) was line 2123, in the zend_mm_check_leaks function. The value was sourced from dbg->filename, which already contains the invalid pointer, so we repeat the process to discover the source of that variable.

(rr) delete 1
(rr) watch -l dbg->filename
Hardware watchpoint 2: -location dbg->filename
(rr) reverse-continue 
Continuing.
Hardware watchpoint 2: -location dbg->filename

Old value = 0xa8bc37 <error: Cannot access memory at address 0xa8bc37>
New value = 0x0
__mempcpy_sse2 () at ../sysdeps/x86_64/memcpy.S:219
219        movq     %r8,  8(%rdi)
(rr) bt
#0  __mempcpy_sse2 () at ../sysdeps/x86_64/memcpy.S:219
#1  0x00007f870ec8f55e in __GI__IO_file_xsgetn (fp=0x56128d40a9a0, data=<optimized out>, n=18446744073709551615) at fileops.c:1392
#2  0x00007f870ec848b6 in __GI__IO_fread (buf=<optimized out>, size=1, count=18446744073709551615, fp=0x56128d40a9a0) at iofread.c:42
#3  0x00007f870be6ed79 in fileGetbuf (ctx=0x7f86ffa5a0e0, buf=0x7f86ffa5e0a0, size=-1) at php-7.0.5-debug/ext/gd/libgd/gd_io_file.c:91
#4  0x00007f870be6e47e in php_gd_gdGetBuf (buf=0x7f86ffa5e0a0, size=-1, ctx=0x7f86ffa5a0e0) at php-7.0.5-debug/ext/gd/libgd/gd_io.c:131
#5  0x00007f870be6c79c in _gd2ReadChunk (offset=1176, compBuf=0x7f86ffa5e0a0 '\220' <repeats 40 times>, "\242", <incomplete sequence \354\266>, compSize=-1, chunkBuf=0x7f86ffa70000 'A' <repeats 100 times>, chunkLen=0x7ffd14c6e898, 
    in=0x7f86ffa5a0e0) at php-7.0.5-debug/ext/gd/libgd/gd_gd2.c:213
#6  0x00007f870be6cad8 in php_gd_gdImageCreateFromGd2Ctx (in=0x7f86ffa5a0e0) at php-7.0.5-debug/ext/gd/libgd/gd_gd2.c:311
#7  0x00007f870be6c801 in php_gd_gdImageCreateFromGd2 (inFile=0x56128d40a9a0) at php-7.0.5-debug/ext/gd/libgd/gd_gd2.c:232
#8  0x00007f870be5d337 in _php_image_create_from (execute_data=0x7f86ffa130d0, return_value=0x7f86ffa130c0, image_type=9, tn=0x7f870c5b4e77 "GD2", func_p=0x7f870be6c7d9 <php_gd_gdImageCreateFromGd2>, 
    ioctx_func_p=0x7f870be6c86c <php_gd_gdImageCreateFromGd2Ctx>) at php-7.0.5-debug/ext/gd/gd.c:2385
#9  0x00007f870be5d572 in zif_imagecreatefromgd2 (execute_data=0x7f86ffa130d0, return_value=0x7f86ffa130c0) at php-7.0.5-debug/ext/gd/gd.c:2483
...
#28 0x000056128c671437 in main (argc=2, argv=0x7ffd14c71688) at main.c:777

Executing in reverse we discover the corruption was caused by a call to __GI__IO_freadwith a count of -1, which is the overflow leveraged by the PoC. At this point we might like to know a few other things, such as how much data was actually read in, as well as how big the destination buffer is.

The first value is trivial to find, in the same way as you normally would with gdb, as it is the return value of the fread function.

(rr) f 3
#3 0x00007f7958587d79 in fileGetbuf (ctx=0x7f794c05a0e0, buf=0x7f794c05e0a0, size=-1) at php-7.0.5-debug/ext/gd/libgd/gd_io_file.c:91
91 return fread(buf, 1, size, fctx->f);
(rr) finish
Run till exit from #3 0x00007f7958587d79 in fileGetbuf (ctx=0x7f794c05a0e0, buf=0x7f794c05e0a0, size=-1) at php-7.0.5-debug/ext/gd/libgd/gd_io_file.c:91
php_gd_gdGetBuf (buf=0x7f794c05e0a0, size=-1, ctx=0x7f794c05a0e0) at php-7.0.5-debug/ext/gd/libgd/gd_io.c:132
132 }
Value returned is $2 = 612

To find the size of the destination buffer (which is at address 0x7f86ffa5e0a0) we can look over the backtrace to see the first function that doesn’t take it as an argument (php_gd_gdImageCreateFromGd2Ctx), set a breakpoint where it calls the first function in the backtrace that does take the buffer as an argument and replay the execution again:

(rr) f 6
#6  0x00007f870be6cad8 in php_gd_gdImageCreateFromGd2Ctx (in=0x7f86ffa5a0e0) at php-7.0.5-debug/ext/gd/libgd/gd_gd2.c:311
311                    if (!_gd2ReadChunk(chunkIdx[chunkNum].offset, compBuf, chunkIdx[chunkNum].size, (char *) chunkBuf, &chunkLen, in)) {
(rr) b 311
Breakpoint 6 at 0x7f870be6ca88: file php-7.0.5-debug/ext/gd/libgd/gd_gd2.c, line 311.
(rr) r
The program being debugged has been started already.
Start it from the beginning? (y or n) y
Starting program: /usr/sbin/httpd 

[Thread 57236.57236] #1 stopped.
0x00007f8710739c80 in _start () from /lib64/ld-linux-x86-64.so.2
(rr) c
Continuing.
AH00558: httpd: Could not reliably determine the server's fully qualified domain name, using localhost.localdomain. Set the 'ServerName' directive globally to suppress this message
warning: Temporarily disabling breakpoints for unloaded shared library "/usr/lib64/httpd/modules/libphp7.so"
[New Thread 57236.57239]

Breakpoint 6, php_gd_gdImageCreateFromGd2Ctx (in=0x7f86ffa5a0e0) at php-7.0.5-debug/ext/gd/libgd/gd_gd2.c:311
311                    if (!_gd2ReadChunk(chunkIdx[chunkNum].offset, compBuf, chunkIdx[chunkNum].size, (char *) chunkBuf, &chunkLen, in)) {
(rr) p compBuf
$13 = 0x7f86ffa5e0a0 ""

Now we’re back to the familiar problem of having a variable (compBuf) and wanting to know where its value came from, so we set a watchpoint and switch from forwards execution to reverse execution to find the allocation site of the buffer, and its size.

(rr) watch -l compBuf
Hardware watchpoint 7: -location compBuf
(rr) reverse-continue 
Continuing.
Hardware watchpoint 7: -location compBuf

Old value = 0x7f86ffa5e0a0 ""
New value = 0x0
0x00007f870be6ca1d in php_gd_gdImageCreateFromGd2Ctx (in=0x7f86ffa5a0e0) at php-7.0.5-debug/ext/gd/libgd/gd_gd2.c:292
292            compBuf = gdCalloc(compMax, 1);
(rr) p compMax
$14 = 112

Finally, for the sake of completeness, it might be useful to know what the data represented before it was corrupted, which will tell us what the key difference between crashing and non-crashing runs is. Since the data flows straight from the overflow location to its first use in zend_mm_check_leaks, which is a function internal to the allocator and which operates on heap metadata, a reasonable assumption is that the overflow corrupts something other than dbg->filename, which tricks the allocator into thinking that dbg->filename is a valid pointer to a string. If we look at zend_mm_check_leaks we can confirm this may be the case:

(rr) l
2118 j = 0;
2119 while (j < bin_elements[bin_num]) {
2120     if (dbg->size != 0) {
2121         leak.addr = (zend_mm_debug_info*)((char*)p + ZEND_MM_PAGE_SIZE * i + bin_data_size[bin_num] * j);
2122         leak.size = dbg->size;
2123         leak.filename = dbg->filename;
2124         leak.orig_filename = dbg->orig_filename;
2125         leak.lineno = dbg->lineno;
2126         leak.orig_lineno = dbg->orig_lineno;

We can assume based on the above that the entire dbg object has been corrupted, and because dbg->size has been changed to a non-zero value we have ended up at the crash location that we have. This can be confirmed by tracing the value to its source in the same way as before:

(rr) awatch -l dbg->size
Hardware access (read/write) watchpoint 4: -location dbg->size
(rr) reverse-continue 
Continuing.
Hardware access (read/write) watchpoint 4: -location dbg->size

Value = 4665427
0x00007f7db1825b9c in zend_mm_check_leaks (heap=0x7f7da5200040) at /home/sean/Documents/Git/EntomologyPrivate/PHP/CVE-2016-3074/php-7.0.5-debug/Zend/zend_alloc.c:2122
2122 leak.size = dbg->size;
(rr) 
Continuing.
Hardware access (read/write) watchpoint 4: -location dbg->size

Value = 4665427
0x00007f7db1825b56 in zend_mm_check_leaks (heap=0x7f7da5200040) at /home/sean/Documents/Git/EntomologyPrivate/PHP/CVE-2016-3074/php-7.0.5-debug/Zend/zend_alloc.c:2120
2120 if (dbg->size != 0) {
(rr) 
Continuing.
Hardware access (read/write) watchpoint 4: -location dbg->size

Old value = 4665427
New value = 0
__mempcpy_sse2 () at ../sysdeps/x86_64/memcpy.S:218
218 movq %rax, (%rdi)
(rr) bt
#0 __mempcpy_sse2 () at ../sysdeps/x86_64/memcpy.S:218
#1 0x00007f7db43df55e in __GI__IO_file_xsgetn (fp=0x563db9fbb9a0, data=<optimized out>, n=18446744073709551615) at fileops.c:1392
#2 0x00007f7db43d48b6 in __GI__IO_fread (buf=<optimized out>, size=1, count=18446744073709551615, fp=0x563db9fbb9a0) at iofread.c:42
#3 0x00007f7db15bed79 in fileGetbuf (ctx=0x7f7da525a0e0, buf=0x7f7da525e0a0, size=-1) at php-7.0.5-debug/ext/gd/libgd/gd_io_file.c:91
#4 0x00007f7db15be47e in php_gd_gdGetBuf (buf=0x7f7da525e0a0, size=-1, ctx=0x7f7da525a0e0) at php-7.0.5-debug/ext/gd/libgd/gd_io.c:131
#5 0x00007f7db15bc79c in _gd2ReadChunk (offset=1176, compBuf=0x7f7da525e0a0 '\220' <repeats 40 times>, "\242", <incomplete sequence \354\266>, compSize=-1, chunkBuf=0x7f7da5270000 'A' <repeats 100 times>, chunkLen=0x7fff6af192a8, 
 in=0x7f7da525a0e0) at php-7.0.5-debug/ext/gd/libgd/gd_gd2.c:213
#6 0x00007f7db15bcad8 in php_gd_gdImageCreateFromGd2Ctx (in=0x7f7da525a0e0) at php-7.0.5-debug/ext/gd/libgd/gd_gd2.c:311
#7 0x00007f7db15bc801 in php_gd_gdImageCreateFromGd2 (inFile=0x563db9fbb9a0) at php-7.0.5-debug/ext/gd/libgd/gd_gd2.c:232
...

Above we can see that it was, as we presumed, the overflow that corrupted dbg->size. To figure out what its value was before it was corrupted, and what code set that value, we just reverse-continue again.

(rr) reverse-continue 
Continuing.
Hardware watchpoint 2: -location dbg->size

Old value = 0
New value = <unreadable>
_raw_syscall () at /home/sean/Documents/Git/rr/rr/src/preload/raw_syscall.S:120
120 callq *32(%rsp)
(rr) bt
#0 _raw_syscall () at /home/sean/Documents/Git/rr/rr/src/preload/raw_syscall.S:120
#1 0x00007f795cc261ab in traced_raw_syscall (call=<optimized out>) at /home/sean/Documents/Git/rr/rr/src/preload/preload.c:282
#2 sys_readlink (call=<optimized out>) at /home/sean/Documents/Git/rr/rr/src/preload/preload.c:1914
#3 syscall_hook_internal (call=0x7fff28911668) at /home/sean/Documents/Git/rr/rr/src/preload/preload.c:2345
#4 0x00007f795cc25b81 in syscall_hook (call=0x7fff28911668) at /home/sean/Documents/Git/rr/rr/src/preload/preload.c:2396
#5 0x00007f795cc29cea in _syscall_hook_trampoline () at /home/sean/Documents/Git/rr/rr/src/preload/syscall_hook.S:170
#6 0x00007f795cc29cfb in _syscall_hook_trampoline_48_3d_01_f0_ff_ff () at /home/sean/Documents/Git/rr/rr/src/preload/syscall_hook.S:221
#7 0x00007f795b42b960 in mmap64 () at ../sysdeps/unix/syscall-template.S:84
#8 0x00007f79587eb2dd in zend_mm_mmap (size=4190208) at /home/sean/Documents/Git/EntomologyPrivate/PHP/CVE-2016-3074/php-7.0.5-debug/Zend/zend_alloc.c:477
#9 0x00007f79587eba73 in zend_mm_chunk_alloc_int (size=2097152, alignment=2097152) at /home/sean/Documents/Git/EntomologyPrivate/PHP/CVE-2016-3074/php-7.0.5-debug/Zend/zend_alloc.c:767
#10 0x00007f79587ede46 in zend_mm_init () at /home/sean/Documents/Git/EntomologyPrivate/PHP/CVE-2016-3074/php-7.0.5-debug/Zend/zend_alloc.c:1828
...

(rr) f 8
#8 0x00007f79587eb2dd in zend_mm_mmap (size=4190208) at /home/sean/Documents/Git/EntomologyPrivate/PHP/CVE-2016-3074/php-7.0.5-debug/Zend/zend_alloc.c:477
477 ptr = mmap(NULL, size, PROT_READ | PROT_WRITE, MAP_PRIVATE | MAP_ANON, -1, 0);

We can see that our hypothesis is correct and that prior to the overflow dbg->size was zero, having being allocated during the initialisation of the memory manager and not used after that. At this point we have a fairly good idea of why the PoC is triggering the crash we’re seeing, and for the purposes of this post we’re done!

All of the above takes a few minutes in total, as reverse execution has a barely noticeable overhead and thus can be integrated into your normal workflow. Higher overhead tools, such as taint trackers, have their place and can offer more automated or more complete answers, but rr finds a sweet-spot between performance and capability that makes it a very interesting tool.

Entirely Unrelated Training Update

There are still seats available for the London/NYC editions of Advanced Tool Development with SMT Solvers, scheduled for this August. These are likely to be the only public editions in the near future, so if you’d like to attend send an email to contact@vertex.re ASAP.


[1] It doesn’t actually execute in reverse in the sense of walking backwards through the instruction stream. The video linked to above provides some detail on what actually happens.

[2] I can only guess this is the intended operation of the PoC as I never got it to work in its original form.

Fuzzing Language Interpreters Using Regression Tests

At INFILTRATE ’14 I gave a talk on the topic of fuzzing language interpreters. The slides are now available here. The results generated by the system presented and, subsequent, related work, were sufficiently good that my bottleneck quite soon moved from bug discovery to crash triage, which ended up forming the basis for my talk at INFILTRATE ’16.

The question addressed in the talk is ‘How can we fuzz stateful APIs in an efficient manner?’, where ‘efficient’ in this case means we want to reduce the number of wasted tests. For a stateful API, it’s probable that a given API call requires a preceding set of API calls to have set the environment into a particular state before it does anything ‘interesting’. If we don’t make an attempt to set up the environment correctly then we will likely end up with a lot of our tests discarded without exercising new functionality.

As you’ve probably guessed, and as I would assume many other people have concluded before me: a good source of such information is existing code written using the API. In particular, regression tests (and other test types) often provide self-contained examples of how to exercise a particular API call.

The talk itself is in two parts: firstly, a minimal system which works versus ‘easy’ targets, such as PHP and Ruby, and secondly, a more complex system which works versus more difficult targets, such as the JS interpreters found in web browsers.

Given that this talk was two years ago, the ideas in it have evolved somewhat and if you are interested in fuzzing either category of software mentioned above I would offer the following advice:

  1. For the easier targets, compile them with ASAN, extract the tests as mentioned and mutate them using something like radamsa. ASAN plus some batch scripts to automate execution and crash detection is sufficient to reproduce the results mentioned and also to find bugs in the latest versions of these interpreters. The system mentioned in the slides ended up being overkill for these targets.
  2. For the harder targets, a reimplementation of Langfuzz by Holler et al is probably a good first port of call. Also, rather than going down the somewhat insane route of hand-coding Javascript parsing and AST traversal in Go, the esprima and estraverse libraries make the process a lot less painful. My only excuse for not doing this to begin with is along the lines of ‘I’ve just learned Go and I must use it for everything!’. I have too much free time.

On the topic of program analysis: if you are interested in learning about SMT-based analysis engines the early-bird rate for the public editions of ‘Advanced Tool Development with SMT Solvers’ is available for another week. The details, including a syllabus, are here, and if you are interested drop me an email via contact@vertex.re.

Some Early-Stage Work on Statistical Crash Triage

Last week at Infiltrate I presented some early-stage work on crash triage under the title “Automated Root Cause Identification for Crashing Executions“. The slides can be found here, and the presentation notes contain further details in draft form.

A better title for this work would probably have been “Statistical Crash Triage” or possibly something involving the term “predicate synthesis“, as really those things are at the core of what was presented. The main algorithm can be summarised fairly quickly as follows:

  1. Run the target application on all the good inputs and all the bad inputs. Record coverage information.
  2. Use the coverage information to predict what functions are likely relevant to the crash.
  3. Rewrite those functions to insert instrumentation which will record all computed values and other properties.
  4. Rerun the instrumented version of the target application on all the good and bad inputs.
  5. From the recorded state, and predicate templates, synthesise and evaluate predicates over the program’s variables.
  6. Apply a lightweight statistical analysis to the evaluations of these predicates to shake out those relevant to the crash from those that are not.

The actual details are in the slides so I won’t go into that any further. The advantages of this approach are that it isn’t tuned towards one bug type, or class of applications, and simply relies on large amounts of input data and lightweight analyses to discover ‘interesting’ things. Alongside that, the analyses at each stage are parallelisable and so it’s quite simple to scale up. On a reasonably sized target (PHP) the approach is fast enough to fit into a normal workflow.

The most significant downside is that the generality means that if a bug is best described by a very complicated/precise predicate it may not be discovered (although more simple predicates may be, which can help a user manually discover the precise predicate more easily). In terms of the work as a whole there is also a weakness in the limited evaluation so far, but this is something I’m currently in the process of alleviating. In particular I’m working on testing with a wider variety of memory management issues as those pose some unique challenges for the algorithm above.

Besides the analysis algorithm itself, I also want to quickly mention CrashCorpus*. This is a corpus I’m currently working on for the evaluation of crash triage (and related) tools. A significant issue with the academic literature is that the algorithms tend to be tested almost exclusively on toy programs or synthetic bugs. The goal of CrashCorpus is to eliminate that by providing easy to build, easy to run, real-world targets. I’ll have more info on this once I get closer to a public release.

* I’m still building towards a public release of the corpus as it needs more targets before it is truly useful, but if you’d like to contribute drop me an email (sean _at_ vertex.re). All I require is a set of crashing inputs, a set of non-crashing inputs and the source code for the target. I’ll take care of the rest.


Infiltrate 2011 Slides

The slides for most of the talks from this years Infiltrate have gone online! Among them you can find the slide deck for Attacking the WebKit Heap, which Agustin and I gave.

The talks were awesome and I’d recommend grabbing them all. Halvar’s, titled State Spaces and Exploitation, was one of my favourites. I generally believe that the reason we in industry, as well as university based research groups, sometimes fail to build better tools is because we don’t spend enough time reflecting on the nature of exploitation and bug finding and as a result end up solving the wrong problems. Halvar spent about half of his talk addressing one way to think about exploits, which is programming a ‘weird machine’ that lives inside a program and is unlocked by a bug trigger. It’s an interesting way to look at things and, as he mentioned, similar to how many of us think of exploit development when it comes down to it.

As far as I know, we’ll only be releasing audio for one of the talks, Nico’s keynote on Strategic Surprise, which can be found here. Also worth checking out, educational, funny and just a little bit troll-y … what more can you ask =D

“We don’t care about nulls because this ain’t no strcpy shit” – Ryan Austin, by consensus the best quote of the conference.

Finding Optimal Solutions to Arithmetic Constraints

This post is a follow on to my previous ones on automatically determining variable ranges and on uses for solvers in code auditing sessions. In the first of those posts I showed how we can use the symbolic execution engine of ID to automatically model code and then add extra constraints to determine how it restricts the state space for certain variables. In the second I looked at one use case for manual modelling of code and proving properties about it as part of C++ auditing.

In this post I’m going to talk about a problem that lies between the previous two cases. That is, manually modelling code, but using Python classes provided by ID in a much more natural way than with the SMT-LIB language, and looking for optimal solutions to a problem rather than a single one or all possible solutions.

Consider the following code, produced by HexRays decompiler from an x86 binary. It was used frequently throughout the binary in question to limit the ranges allowed by particular variables. The first task is to verify that it does restrict the ranges of width and height as it is designed to. Its purpose is to ensure that v3 * height is less than 0x7300000 where v3 is derived from width.


int __usercall check_ovf(int width, int height,
    int res_struct)
{
  int v3; // ecx@1

  v3 = ((img_width + 31) >> 3) & 0xFFFFFFFC;
  *(_DWORD *)(res_struct + 12) = width;
  *(_DWORD *)(res_struct + 16) = height;
  *(_DWORD *)(res_struct + 20) = v3;
  if ( width <= 0 || height <= 0 ) // 1
  {
    *(_DWORD *)(res_struct + 24) = 0;
    *(_DWORD *)(res_struct + 28) = 0;
  }
  else 
  {
    if ( height * v3 <= 0 || 120586240 / v3 <= height ) // 2
      *(_DWORD *)(res_struct + 24) = 0;
    else
      *(_DWORD *)(res_struct + 24) = malloc_wrapper(res_struct,
                                       120586240 % v3,
                                       height * v3); // 3
    *(_DWORD *)(res_struct + 28) = 1;
  }
  return res_struct;


If the above code reaches the line marked as 3 a malloc call will occur with height * v3 as the size argument. Can this overflow? Given the checks at 1 and 2 it’s relatively clear that this cannot occur but for the purposes of later tasks we will model and verify the code.

One of the things that becomes clear when using the SMT-LIB language (even version 2 which is considerably nicer than version 1) is that using it directly is still quite cumbersome. This is why in recent versions of Immunity Debugger we have added wrappers around the CVC3 solver that allow one to build a model of code using Python expressions (credit for this goes to Pablo who did an awesome job). This was one of the things we covered during the recent Master Class at Infiltrate and people found it far easier than using the SMT-LIB language directly.

Essentially, we have Expression objects that represent variables or concrete values and the operators on these expressions (+, -, %, >> etc) are over-ridden so that they make assertions on the solvers state. For example, if x and y are Expression objects then x + y is also an Expression object representing the addition of x and y in the current solver context. Using the assertIt() function of any Expression object then asserts that condition to hold.

With this in mind, we can model the decompiled code in Python as follows:


import sys
import time

sys.path.append('C:\\Program Files\\Immunity Inc\\Immunity Debugger\\Libs\\x86smt')

from prettysolver import Expression
from smtlib2exporter import SmtLib2Exporter

def check_sat():
    img_width = Expression("img_width", signed=True)
    img_height = Expression("img_height", signed=True)
    tmp_var = Expression("tmp_var", signed=True)

    const = Expression("const_val")
    (const == 0x7300000).assertIt()
    
    (img_width > 0).assertIt()
    (img_height > 0).assertIt()
    
    tmp_var = ((img_width + 31) >> 3) & 0xfffffffc
    (img_height * tmp_var > 0).assertIt()
    (const / tmp_var > img_height).assertIt()

    expr = (((tmp_var * img_height) &
            0xffffffff000000000) != 0)  # 1
    expr.assertIt()

    s = SmtLib2Exporter()
    s.dump_to_file(expr, 'test.smt2') # 2
    
    # After this we can check with z3 /smt2 /m test.smt2
    # Alternatively we can use expr.isSAT which calls CVC3 but it
    # is a much slower solver

    start_time = time.time()
    if expr.isSAT():
        print 'SAT'
        print expr.getConcreteModel()
    else:
        print 'UNSAT'

    print 'Total run time: %d seconds' % (time.time() - start_time)

if __name__ == '__main__':
    check_sat()


The above code (which can be run from the command-line completely independently of Immunity Debugger) models the parts of the decompiled version that we care about. The added condition, marked as 1 checks for integer overflow by performing a 64-bit multiplication and then checking if the upper 32 bits are 0 or not. The first thing to note about this code is that it models the decompiled version quite naturally and is far easier to write and understand than the SMT-LIB alternative. This makes this kind of approach to analysing code much more tractable and means that once you are familiar with the API you can model quite large functions in very little time. For example, asserting that the condition if ( height * v3 <= 0 || 120586240 / v3 <= height ) must be false translates to the following, which is syntactically quite close to the C code:


tmp_var = ((img_width + 31) >> 3) & 0xfffffffc
(img_height * tmp_var > 0).assertIt()
(const / tmp_var > img_height).assertIt()


Checking if the function does in fact prevent integer overflow is then simple.

Using the solver to check if an overflow is possible on the argument to malloc

So, modulo modelling errors on our behalf, the check is safe and prevents an overflow on the size argument to malloc*. So what now? Well, in the case of this particular code-base an interesting behaviour appeared later in the code if the product of width and height is sufficiently large and the above function succeeded in allocating memory. That is, the height and width were small enough such that height * v3 was less than 0x7300000 but due to multiplication with other non-constants later in the code may then overflow. The question we then want to answer is, what is the maximum value of image * height that can be achieved that also passes the above check?

Solving Optimisation Problems with Universal Quantification**

This problem is essentially one of optimisation. There are many assignments to the input variables that will pass the overflow check but we are interested in those that maximise the resulting product image and height. Naturally this problem can be solved on paper with relative ease for small code fragments but with longer, more complex code this approach quickly becomes an more attractive.

The first thing to note is that at the line marked as 2 in the above Python code we used a useful new feature of ID, the SmtLib2Exporter***, to dump the model constructed in CVC3 out to a file in SMT-LIB v2 syntax. This is useful for two reasons, firstly we can use a solver other than CVC3, e.g. Z3 which is much faster for most problems, and secondly we can manually modify the formula to include things that our Python wrapper currently doesn’t have, such as universal quantification.

Universal quantification, normally denoted by the symbol ∀ and the dual to existential quantification, is used to apply a predicate to all members of a set. e.g. ∀x ∈ N.P(x) states that for all elements x of the natural numbers some predicate P holds. Assume that the conditions of the integer overflow check are embodied in a function called sat_inputs and M is the set of natural numbers module 2^32 then the formula that we want to check is (sat_inputs(x, y) => (∀ a, b ∈ M | sat_inputs(a, b), x * y >= a * b)), that is that we consider x and y to be solutions if x and y satisfy the conditions of sat_inputs implies that the product x * y is greater or equal to the product of any other two values a and b that also satisfy sat_inputs. This property is encoded in the function is_largest in the following SMT-LIB v2 code. The rest of the code is dumped by the previous Python script so checking this extra condition was less than 5 lines of work for us. The details of sat_inputs has been excluded for brevity. It simply encodes the semantics the integer overflow checking code.


(declare-funs ((img_width BitVec[32])(img_height BitVec[32])))

(define-fun sat_inputs ((img_width BitVec[32])(img_height BitVec[32])) Bool
    (and
         ; Model of the code goes here
    )
)

(define-fun is_largest ((i BitVec[32])(j BitVec[32])) Bool
    (forall ((a BitVec[32]) (b BitVec[32]))
        (implies (sat_inputs a b)
            (bvsge (bvmul i j) (bvmul a b))
        )
    )
)

(assert (and
    (sat_inputs img_width img_height)
    (is_largest img_width img_height)
    )
)

(check-sat)
(get-info model)
Finding the maximum product of height and width

Running this through Z3 takes 270 seconds (using universal quantification results in a significant increase in the problem size) and we are provided with an assignment to the height and width variables that not only pass the checks in the code but are guaranteed to provide a maximal product. The end result is that with the above two inputs height * width is 0x397fffe0, which is guaranteed to be the maximal product, and height * (((width + 31) >> 3) & 0xfffffffc) is 0x72ffffc, as you would expect, which is less than 0x7300000 and therefore satisfies the conditions imposed by the code. Maximising or minimising other variables or products is similarly trivial, although for such a small code snippet not particularly interesting (Even maximising the product of height and width can be done without a solver in your head pretty easily but instructive examples aren’t meant to be rocket science).

This capability becomes far more interesting on larger or more complex functions and code paths. In such cases the ability to use a solver as a vehicle for precisely exploring the state space of a program can mean the difference between spotting a subtle bug and missing out.

Conclusion
By its nature code auditing is about tracking state spaces. The task is to discover those states implied by the code but not considered by the developer. In the same way that one may look at a painting and discover meaning not intended by the artist, an exploit developer will look at a program and discover a shadow-program, not designed or purposefully created, but in existence nonetheless. In places this shadow-program is thick, it is easily discovered, has many entry points and can be easily leveraged to provide exploit primitives. In other places, this shadow-program clings to the intended program and is barely noticeable. An accidental decrement here, an off-by-one bound there. Easy to miss and perhaps adding few states to the true program. It is from these cases that some of the most entertaining exploits derive. From state spaces that are barren and lacking in easily leveragable primitives. Discovering such gateway states, those that move us from the intended program to its more enjoyable twin, is an exercise in precision. This is why it continues to surprise me that we have such little tool support for truly extending our capacity to deal with massive state spaces in a precise fashion.

Of course we have some very useful features for making a program easier to manually analyse, among them HexRays decompiler and IDA’s various features for annotating and shaping a disassembly, as well as plugin architectures for writing your own tools with Immunity Debugger, IDA and others. What we lack is real, machine driven, assistance in determining the state space of a program and, dually, providing reverse engineers with function and basic block level information on how a given chunk of code effects this state space.

While efforts still need to be made to develop and integrate automation technologies into our workflows I hope this post, and the others, have provided some motivation to build tools that not only let us analyse code but that help us deal with the large state spaces underneath.


* As a side note, Z3 solves these constraints in about half a second. We hope to make it our solving backend pretty soon for obvious reasons.
** True optimisation problems in the domain of satisfiability are different and usually fall under the heading of MaxSAT and OptSAT. The former deals with maximising the number of satisfied clauses while the latter assigns weights to clauses and looks for solutions that minimise or maximise the sum of these weights. We are instead dealing with optimisation within the variables of the problem domain. OptSAT might provide interesting solutions for automatic gadget chaining though and is a fun research area.
*** This will be in the next release which should be out soon. If you want it now just drop me a mail.

Thanks to Rolf Rolles for initially pointing out the usefulness of Z3’s support for universal/existential quantification for similar problems.

Exploit Necromancy in TCMalloc – Reviving the 4-to-N Byte Overflow Primitive with Insert to FreeList[X]

A couple of months back while looking into a heap overflow in Chrome* I found myself poking around in the internals of TCMalloc. What I found there was pretty interesting. Perhaps the implementers have been watching Twitter and decided to take a proactive approach to security researchers moaning about the difficulties of modern heap exploitation. Maybe they just got caught up in making a blazing fast allocator and couldn’t bring themselves to slow it down with nasty things like integrity checks. Either way, TCMalloc provides a cosy environment for heap exploits to thrive and is worth fully exploring to discover the possibilities it provides.

At Infiltrate next weekend, Agustin Gianni and I will be discussing (among other things) TCMalloc from the point of view of exploitation. Essentially our research into TCMalloc wasn’t so much ‘research’ as it was vulnerability necromancy. In the name of speed TCMalloc has forsaken almost any type of sanity checks you might think of. There are annoyances of course but they are artefacts of the algorithms rather than coherent attempts to detect corruption and prevent exploitation. As a result we can revive a number of primitives from heap exploits past as well as some unique to TCMalloc.

Like most custom allocators, TCMalloc operates by requesting large chunks of memory from the operating system via mmap, sbrk or VirtualAlloc and then uses its own methods to manage these chunks on calls to malloc, free, new, delete etc. Agustin wrote a high level overview here and Google’s project page is also useful for gaining a general idea of its workings. In this post I’m not going to go into the exact details of how the memory is managed (come see our presentation for that!) but instead briefly discuss how thread local free lists function and one useful exploit primitive we gain from it.

ThreadCache FreeList allocation
The front end allocator for TCMalloc (with TC standing for ThreadCache) consists of kNumClasses** per-thread free lists for allocations of size < 32768. The FreeLists store chunks of the same size. The bucket sizes are generated in SizeMap::Init and allocations that don’t map directly to a bucket size are simply rounded up to the next size. For allocations larger than 32768 the front end allocator is the PageHeap which stores Spans (runs of contiguous pages) and is not thread specific. The following code shows the interface to the allocator through a call to malloc***.

3604 static ALWAYS_INLINE void* do_malloc(size_t size) {
3605   void* ret = NULL;
3606 
...
3611   // The following call forces module initialization
3612   TCMalloc_ThreadCache* heap = TCMalloc_ThreadCache::GetCache();
...
3621   if (size > kMaxSize) {
3622     // Use page-level allocator
3623     SpinLockHolder h(&pageheap_lock);
3624     Span* span = pageheap->New(pages(size));
3625     if (span != NULL) {
3626       ret = SpanToMallocResult(span);
3627     }
3628   } else {
3629     // The common case, and also the simplest.  This just pops the
3630     // size-appropriate freelist, afer replenishing it if it's empty.
3631     ret = CheckedMallocResult(heap->Allocate(size));
3632   }
...

At line 3612 the ThreadCache pointer for the current thread is retrieved. This object contains a number of thread specific details but the one we are interested in is the FreeList array. A FreeList object contains some metadata and a singly-linked list of free chunks that are managed by very simple primitives such as SLL_Pop, SLL_Push etc. If the allocation size is less than 32768 then the following code is called to retrieve a chunk of the required size.

2888 ALWAYS_INLINE void* TCMalloc_ThreadCache::Allocate(size_t size) {
2889   ASSERT(size <= kMaxSize);
2890   const size_t cl = SizeClass(size);
2891   FreeList* list = &list_[cl];
2892   size_t allocationSize = ByteSizeForClass(cl);
2893   if (list->empty()) {
...
2896   }
2897   size_ -= allocationSize;
2898   return list->Pop();
2899 }

The correct FreeList is retrieved at line 2891 and presuming that it is not empty we retrieve a chunk by calling the Pop method. This results in a call to SLL_Pop with the address of the pointer to the head of the free list.

 761 static inline void *SLL_Next(void *t) {
 762   return *(reinterpret_cast(t));
 763 }
...
 774 static inline void *SLL_Pop(void **list) {
 775   void *result = *list;
 776   *list = SLL_Next(*list);
 777   return result;
 778 }

Insert to FreeList[X] – Reviving the 4-to-N byte Overflow Primitive
The effect of SLL_Pop is through SLL_Next to follow the list head pointer and retrieve the DWORD there and then make that the new list head. Notice there are no checks of any kind on the value of the *list pointer. When I first saw a crash within TCMalloc it was at line 762 in the SLL_Next function. The value of t was 0x41414141 which I had previously overflowed an allocated chunk with. What this means is that on that call to SLL_Pop the list head was an address that I controlled. How could this happen? Consider the following FreeList layout:

FreeList example

The above FreeList has 3 chunks. For simplicity assume that the addresses of A and B are contiguous****. On the first call to malloc chunk A is returned to the application.

FreeList allocation

Assume an overflow then occurs when the application writes data to A and B is partially corrupted.

Overflow of Chunk A into Chunk B

The first DWORD of B is the pointer to the next chunk in the FreeList and so we have corrupted the singly-linked list. The first chunk is now B and, as we control the first DWORD of this chunk, we control what the next chunk in the FreeList will be. The chunk C is effectively no longer part of the FreeList. The next allocation of this size will then return the chunk B (presuming no free calls on chunks of this size, within this thread, have occured. Free chunks are prepended to the head of the list) and it will give us control of the list head pointer when *list = SLL_Next(*list) executes.

Allocation from a corrupted FreeList

As we control the DWORD at **list we control what the new list head is. In my initial TCMalloc crash this set the list head to 0x41414141. One more allocation of this size will then call SLL_Pop with a controlled list head pointer. The crash I encountered was when SLL_Next attempted to read the next pointer at 0x41414141.

The important part of all this is that by controlling the list head pointer we control the address of the chunk returned and can give back any usable memory region we want to the application. So after one more allocation the situation is as follows:

A memory region of our choosing is handed back to the application

The result of this allocation is a pointer which we control. It is important to note that the first DWORD at this address then becomes the new list head. For a clean exploit it is desirable for either this to be 0x0 or the FreeList list length_ attribute to be 0 after returning our controlled pointer. If we cannot force either of these conditions then future allocations of this size will follow this DWORD, which may not be under our control, and may result in instability in the program before we gain code execution. Another point to note is that if a free call occurs on a pointer that has not previously been noted by TCMalloc as part of a memory region under its control then it will raise an exception that will likely terminate the program. This is important to keep in mind if the memory location we are inserting into the free list is not controlled by TCMalloc. If this is the case then we have to prevent this address from being passed to free before we gain control of the programs execution.

To gain code execution from this primitive it is necessary to find the address of some useful structure to hand back to the application and then have it overwrite that structure with data that we control. For modern systems this will require a memory leak of some kind to find such an address reliably (although heap spraying of useful objects might be an interesting alternative if we can write over one of these objects and then trigger a call through a function pointer or something similar). Despite this requirement, we have a functioning exploit primitive from a heap overflow and one that has not required us to deal with any heap integrity checks or protections. This is not a bad place to be in given the effort that has gone into securing the default allocators for most operating systems.The primitive basically gives the same effect as the Insert to Lookaside technique that was popular on Windows XP but has since been killed on Windows Vista and 7.

Conclusion
In this post I’ve given a quick overview of how we can convert a 4-byte overflow into one that overflows N bytes in an application using TCMalloc. This type of technique has been seen in various places in the past, most notably when overflowing chunks in the Windows XP Lookaside list. It has been largely killed elsewhere but due to the lack of integrity checks in TCMalloc it lives on in a relatively easy to use fashion.

At Infiltrate Agustin and I will discuss a variety of topics related to exploiting WebKit and TCMalloc in much greater detail. The Insert to FreeList[X] technique is but one example of a simple and old heap exploitation tactic that has been revived. Many other exploitation vectors exist and with a grasp of how the allocator works the possibilities are interesting and varied. In our presentation we will describe some of these techniques and also the details of how TCMalloc manages the processes of allocation and deallocation such as is relevant to manipulating the heap for exploitation.


* TCMalloc is not the allocator used by the Chrome Javascript engine V8. That has its own allocator that can be found in the src/v8/src/ directory of the Chrome source. Have a look at spaces.[cc|h] and platform_X.cc to get started.
** For WebKit in Safari kNumClasses is 68 but for Chrome it is 61. There seem to be some other differences between the various uses of TCMalloc and are worth keeping in mind. For example, in Chrome the maximum free list length is 8192 whereas in Safari is is 256.
*** We’re looking at the TCMalloc code embedded in WebKit revision 79746 Source/JavaScriptCore/wtf/FastMalloc.cpp. It’s effectively the same as that in the Chrome release and elsewhere, modulo the previous point.
**** FreeLists are created from Spans which are contiguous pages in memory that get subdivided to give the FreeList chunks. The chunks are prepended to the list during creation though so they end up in reverse address order. This means that if A, B are two contiguous addresses then the FreeList will initially be ordered as B -> A. In order to get the desired ordering we need to rearrange the fresh FreeList by allocating B, allocating A, free’ing B and then free’ing A. This will result in the ordering A -> B and another allocation from this FreeList will give back the address A.

Heap Scripts for TCMalloc with GDB’s Python API

When writing heap exploits it’s necessary to be able to view the heap state during debugging. As part of our work on TCMalloc, Agustin and I have written up some heap scripts for Immunity Debugger and GDB that make the process of tracking what TCMalloc is up to quite easy. There are quite a few scripts that do similar things for ID and different heap implementations so in this post I’m going to focus on the GDB side of things. Recent versions of GDB contain an embedded Python interpreter that provides easy access to the internals of an application being debugged. Being able to write scripts in Python to automate debugging tasks is really useful and hopefully the GDB guys will maintain the project.

The scripts I will be discussing in this post can be found here. Copy the gdbinit file your home directory or the one where you will be launching gdb from and rename it to .gdbinit. Modify the pyscripts_dir variable to point to the directory where you extracted the scripts. To load the commands run source /path/to/scripts/dump_free_list.py or source /path/to/scripts/search_free_lists.py. This will make the commands dump_free_list and search_free_lists available within gdb.

The data structures used by TCMalloc are relatively simple so the scripts have little to do besides reading memory and walking lists. Each thread in an application using TCMalloc has its own TCMalloc_ThreadCache object which contains information on the FreeLists for that specific thread. The FreeLists themselves are ThreadCache_FreeList objects, each of which contains a list_ attribute that points to the head of a singly linked list of free chunks. We can access the TLS for a given thread via pthread_self() in GDB and find the ThreadCache_FreeList pointer at the offset -4 from there. The file tcmalloc.py contains abstractions for the ThreadCache_FreeList and TCMalloc_ThreadCache structures. In dump_free_lists.py we can see the initialisation of the ThreadCache abstraction via the following code:

 24         tls = gdb.parse_and_eval("pthread_self()")
 25         # threadlocal_heap is at TLS - 4
 26         threadlocal_heap = buf_to_le(
 27             self.cur_proc.read_memory(tls - 4, DWORD_SIZE))
 28 
 29         tc = ThreadCache(self.cur_proc, threadlocal_heap)

The ThreadCache instance then provides access to the FreeLists for the current thread through getFreeLists. The size classes that TCMalloc uses to bucket chunks together for allocations less than 32768 in size are generated at run-time. To view them run tcmalloc.py outside of gdb with no arguments.

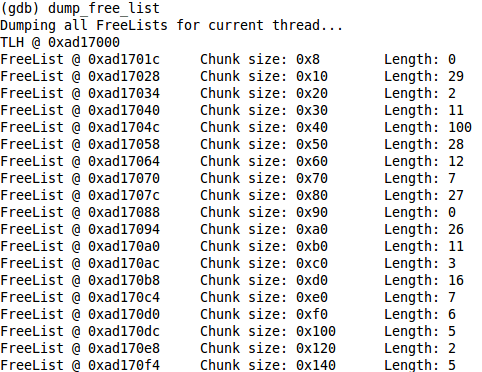
The number of size classes, and hence the number of FreeLists per thread, is dependent a constant that may change between applications embedding TCMalloc. For Chrome it is 61 and hence we have 61 different FreeLists per thread. If we run dump_free_lists within gdb with no arguments it will dump all free lists, their lengths and the chunk size that list is responsible for.

TCMalloc FreeLists within Chrome on Linux

The getFreeLists function will return each of these FreeLists as a FreeList object. This object contains a list_ptr attribute that corresponds to the list_ pointer found in the TCMalloc source for each FreeList. It points to a singly linked list of free chunks that we can iterate over using the getChunks function of a FreeList object.

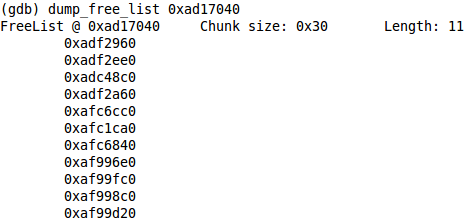
If we run dump_free_lists with one or more space separated addresses it will treat them as pointers to ThreadCache_FreeList structures and dump them accordingly.

The chunks in a given FreeList

The scripts archive also contains the search_free_lists command which will search the FreeLists to see if an address lies within a chunk on any of the FreeLists. After Infiltrate we will release the rest of the scripts for ID and GDB but these should be enough to get you started with TCMalloc and GDBs Python API.

Augment your Auditing with a Theorem Prover

A better post title may have been ‘Outsourcing your thinking when lack of sleep makes basic arithmetic difficult’. Anyways, consider the following code from the  ArrayBuffer::tryAllocate function found in WebCore/html/canvas/ArrayBuffer.cpp.

85	void* ArrayBuffer::tryAllocate(unsigned numElements, unsigned elementByteSize)
86	{
87	    void* result;
88	    // Do not allow 32-bit overflow of the total size
89	    if (numElements) {
90	        unsigned totalSize = numElements * elementByteSize;
91	        if (totalSize / numElements != elementByteSize)
92	            return 0;
93	    }
94	    if (WTF::tryFastCalloc(numElements, elementByteSize).getValue(result))
95	        return result;
96	    return 0;
97	}


Lets ignore for now whether or not you know that the check on line 91 is valid or not. For the sake of argument, assume you’re unsure about whether this code does in fact prevent a situation where totalSize can overflow and the allocation function on line 94 can still get called. In such a situation you could try and reason through on paper whether the check is safe or not, but this is potentially error prone. The other option is to model the code and throw a theorem prover at it. The advantage of this approach is that if the code is safe then you end up with a proof of that fact, while if it’s unsafe you end up with a set of inputs that violate the safety check.

The following is my model of the above code:

[sean@sean-laptop bin]$ cat test.smt
(benchmark uint_ovf
:status unknown
:logic QF_BV

:extrafuns ((totalSize BitVec[32])(numElements BitVec[32])(elSize BitVec[32]))
:extrafuns ((a BitVec[64])(b BitVec[64])(big32 BitVec[64]))

; if (numElements) {
:assumption (bvugt numElements bv0[32])

; unsigned totalSize = numElements * elementByteSize;
:assumption (= totalSize (bvmul numElements elSize))

; totalSize / numElements != elementByteSize
:assumption (= elSize (bvudiv totalSize numElements))

; Check if an overflow is possible in the presence of the 
; above conditions
:assumption (= big32 bv4294967295[64])
:assumption (= a (zero_extend[32] numElements))
:assumption (= b (zero_extend[32] elSize))
:formula (bvugt (bvmul a b) big32)
)


(The above .smt file is in SMTLIB format. Further information can be found at [1], [2] and [3])
The above models tryAllocate pretty much exactly. The final three assumptions and the formula are used to check if the integer overflow can occur. Mixing bitvectors of different types isn’t allowed for most operations so it is necessary first to extend numElements and elSize into 64 bit variables. We then check for overflow by multiplying these 64 bit extensions by each other and checking if the result can be greater than 0xffffffff (big32) while also satisfying the conditions imposed in modelling the function.

[sean@sean-laptop bin]$ ./yices -V
Yices 2.0 prototype. Copyright SRI International, 2009
GMP 4.3.1. Copyright Free Software Foundation, Inc.
Build date: Fri Apr 23 11:15:16 PDT 2010
Platform: x86_64-unknown-linux-gnu (static)
[sean@sean-laptop bin]$ time ./yices -f < test.smt 
unsat

real	0m0.587s
user	0m0.576s
sys	0m0.008s


And there we have it, our proof of safety (modulo modelling errors on my behalf and implementation errors in yices). Given the assumptions specified it is not possible for the multiplication at line 90 to overflow and still satisfy the condition at line 91. Total time from starting modelling to a proof, about 10 minutes.

[1] Logic for quantifier free bit-vector logic
[2] Theory for fixed size bit-vectors
[3] SMT-LIB v2 reference

Edit: I modified the above formula and some of the text after noticing an error. Hence any comments below may refer to an older version of the post.

Validity, Satisfiability and Code Semantics

In a recent post to DD I mentioned some interesting features that will be available in Immunity Debugger 2.0. These features rely on a translation layer from x86 code to SMT formulae that Pablo constructed as part of his work on DEPLIB 2.0. In the past few weeks I got some time to put together a few scripts for ID that replicate some of the more useful tasks that we can use a solver for. In this post I am going to elaborate on one such script which is designed to find ROP gadgets meeting user specified conditions.

find_gadget.py is a relatively simple piece of software which is a testament to Pablo’s API development, the Python programming language and, I think quite importantly, the suitability of mathematical logic for reasoning about machine code. This final point is of course unsurprising but it provides good motivation when considering the merits of abstracting x86 code to more logical/mathematical representations for analysis.

We begin our gadget search by running gadgets.py. Currently this script finds any instruction sequence ending in a ret instruction (with support for pop REG/jmp REG etc. in the works). This takes about 360 seconds to run on QuickTimeAuthoring.qtx (2.16MB) and finds 80,000 candidate gadgets. For now no further analysis is done on these gadgets but we’re working on some fun stuff in that area.

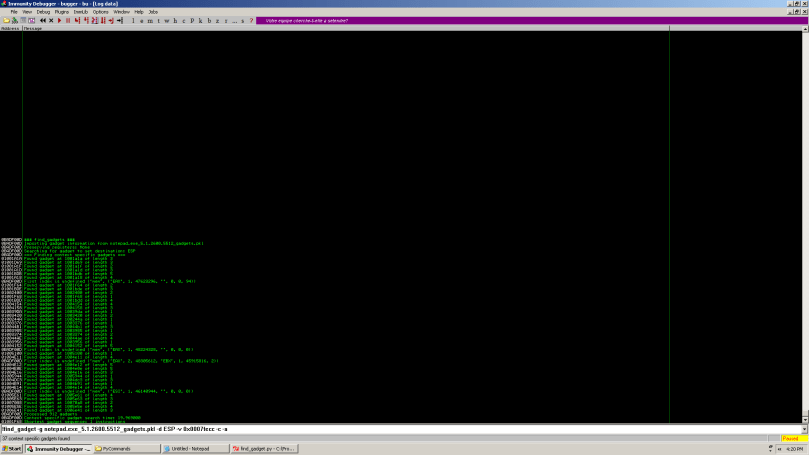
At this point we can use find_gadget.py to search the candidate gadgets for one that meets whatever semantics we have in mind. For now the semantics are specified via the -d, -n and -v/-s options, i.e. DESTINATION RELATION SOURCE/VALUE. For example, to represent EAX <= [EBX+24] we would use -d EAX -n <= -s [EBX+24]. (This is a little cumbersome and not as flexible as one might like so we built a BNF grammar based on pyparsing that allows for arbitrary semantics to be specified as constraints and that should be swapped in pretty soon.) The full set of arguments are shown in this screenshot:

Arguments to find_gadget.py

Once we have specified our arguments the script gets on with the fun part. Our algorithm is as follows:


for gadget in candidiate_gadgets:
    sa = SequenceAnalyzer(reg_model, flag_model, mem_model) # 1
    sa.analyze(gadget.addr, gadget.depth) # 2
    
    if relation == '=':
         rel_expr = sa.solver.eqExpr(dest, src) # 3
    elif relation == '<=':
         ...

    preserve_expr = None
    if preserve_regs != None: # 4
         for reg in preserve_regs:
              eq_expr = sa.solver.eqExpr(sa.regs_before[reg], sa.regs_after[reg])
              preserve_expr = sa.solver.boolAndExpr(preserveExpr, eq_expr)
        rel_expr = sa.solver.boolAndExpr(rel_expr, preserve_expr)

    res = sa.solver.queryFormula(rel_expr) # 5
    if generic_gadgets_only:
         if res == VALID:
              # VALID GADGET FOUND
     else:
          if res == SATISFIABLE:
              # SATISFIABLE GADGET FOUND

#1 Modelling registers, flags and memory
One of the arguments you may have noticed to the script is -c. This argument tells the script that we want to look for ‘context specific’ gadgets that satisfy our semantics when current values in registers, memory and flags are taken into account. The alternative is to look for generic gadgets that will meet the required semantics regardless of the context e.g. inc eax will only set eax to 0 if it previously contained -1 while xor eax, eax will always set it to zero. We’ll discuss this a little more on point #5.

#2 Gadgets to equations
The main coding effort in building this framework was building a transformer for each x86 instruction into the domain of our theorem prover. This requires one to encode accurately the semantics of the instruction over flags, registers and memory and is the backbone of any tool that reasons about assembly code using a solver. This long and drawn out functionality is hidden behind the analyze function which iterates over each instruction and updates the solver state. Once this has completed our solver internally has an accurate representation of the gadgets semantics in the form of several equations.

# 3 & # 4 Adding our gadget constraints
Once one has a representation of a sequence of instructions as equations the next step is typically to append some further constraints derived from the task at hand and then query the solver to determine if they are valid or satisfiable, and if so, to retrieve an input that makes it so. In our case our constraints simply specify a relation between an output register/memory location and an input register/memory location or a constant. We also allow the user to specify a number of registers that the gadget should preserve. We end up with a formula specifying something like (ESP_after == EAX_before+4 AND EBX_after == EBX_before), which is essentially a stack swap with the buffer pointed to by EAX and preserving the EBX register.

# 5 Context specific vs. generic gadgets
After encoding our constraints as a formula in steps #3 and #4 we can then query the solver to determine the status of these constraints in the context of the gadget encoding constructed in step #2. What do we mean by ‘status’? Well, when considering the SAT problem a formula can either be valid, invalid, satisfiable or unsatisfiable. A formula is satisfiable if there exists an assignment to free variables that makes it true and is unsatisfiable otherwise. A formula is valid if its negation is unsatisfiable or invalid otherwise. In other words, a formula is valid if any variable assignment makes it true. Why is this important? If we’re looking for generic gadgets then we want them to meet our constraints regardless of the context, therefore we leave all memory locations, registers and flags free and require that our constraints are VALID in the context of the gadget. That is, there exists no assignment to the memory locations, registers and flags that would result in the gadget not meeting our constraints.

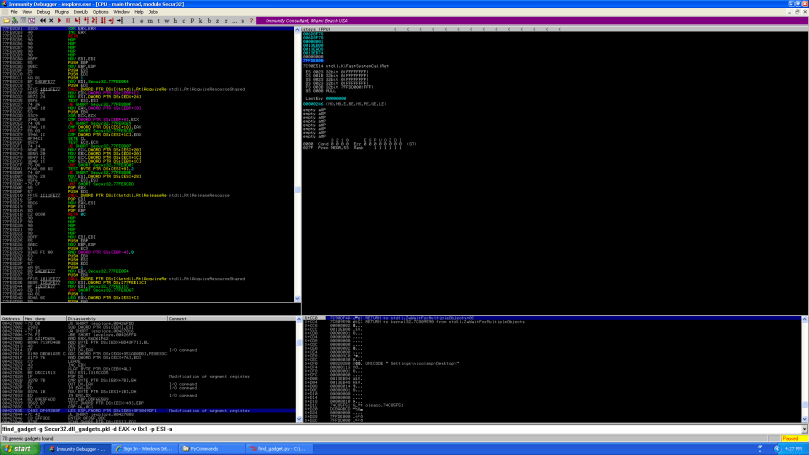
The next few screenshots show some usage examples.

A generic gadget to set EAX to 1
A generic gadget to set EAX to 1 while preserving ESI
Finding multiple gadgets to achieve the same result

find_gadget.py is a very simple script but at the same time can find some very complicated instruction sequences in a short amount of time. In particular it can find tricky stack swapping gadgets and can process about 200,000 gadgets in 3 hours, which is probably a bit quicker than doing it by hand. In some upcoming posts I’ll elaborate a bit more on what can be done with the x86 -> SMT transformer -> solver code. For an idea of some of the things we’re hoping to implement many of the papers published in the last few years on symbolic execution and derived techniques are a good starting point and quite a few are linked from the Practical Software Verification Wiki

Finding use-after-free bugs with static analysis

Earlier this year I had a lot of fun using run-time instrumentation and analysis to tackle a variety of program analysis problems. In doing so I became curious about static solutions to the common problems encountered during dynamic analysis. One of the most obvious issues is that you can only examine those paths that you can execute and thus you need to find some way to drive a program through different paths before you can do any kind of analysis. The flip side of that is that you are guaranteed that any path you analyse is valid and so false positives in that regard are avoided. With those experiences in mind I decided to try my hand at purely static analysis recently (recently as in August, I suck at finding time to document stuff apparently). Static analysis has a large variety of sources of error and annoyances of its own but for certain bug classes it seemed like a purely static approach could find some interesting results with a tolerable level of false positives.

Before I started I considered a few different bug classes in terms of the strengths/weaknesses of static analysis. Certain types of vulnerabilities that depend on the values in registers/memory locations are probably best avoided unless you have the time to either implement a hell of theoretical ideas that can limit the innaccuracy or have the time to sift through thousands of false positives. The bug classes I decided to focus on were those that could generally be reduced to deviations from expected orderings of ‘events’ on a path. Such bug classes include use of memory before initialisation, unchecked use of return values from functions, use after X vulnerabilities (where X is an API call that marks an argument as supposedly unusable e.g. free() or fclose()) and incorrectly ordered sequences of system calls. Eventually I settled on looking for use-after-free vulnerabilities, although the code built to do that works for almost all the mentioned bug classes with a little extending.

(Before continuing I should mention exactly what assumptions and bounds I put on the work I wanted to do. Firstly, I decided to do path insensitive analysis – that is I considered all paths through a control flow graph regardless of whether the path condition is satisfiable or not. To do otherwise would have been extra work and for the vulnerability classes I was considering it didn’t turn out to be a big problem.

Secondly, I decided to do data flow analysis over both registers and memory locations. Some static dataflow analysis (I think binaudit) only considers registers, but in my opinion that misses out on a lot of useful information available at practically zero cost. For instance, if we are doing taint analysis and eax is tainted then after mov [ecx+44], eax; I consider the abstract location denoted by the literal [ecx+44] to also be tainted. It remains in the tainted set until the ecx register is untainted but up until that point it is usable as a source of information.

Thirdly, this project was basically just to give me a taste of the practical side of static analysis so spending a month implementing dataflow analysis for the entire x86 instruction set was out of the question. As a result I implemented the data flow analysis for a small subset of the instruction set I considered to be most relevant to the bug classes considered and wrote a conservative default for all other instructions. That is, for any instructions not specifically considered I make an attempt to guess only their destination operand. The effective result of this is that for such instructions the destination will be removed from whatever analysis I’m doing. This potentially introduces false negatives but also frees up about a month of my life. 😉

Fourthly, when considering loops I only expanded them for one iteration. I haven’t thought too much about the implications of this as there didn’t seem to be a better method without investing time into implementing a bounded loop unwinding technique. It would seem like it might introduce false positives but in my testing I did not encounter anything that could be directly traced back to this weakness. It’s hard to tell if that was due to my small test set, the characteristics of the vulnerabilities I was considering or that my conservative data flow analysis hid the potential false positives.

Fifthly (at this point I’m wishing I’d used 1, 2, 3…), I inititally aimed at intraprocedural analysis and then tacked on some interprocedural fun at the end. I’m quite happy with how my interprocedural hackery worked out but there are probably better (and more time consuming) ways to do it.)

Finding equivalent variables

When doing static analysis you can essentially start at any address that suits the problem at hand. This allows us to divide our algorithm for finding use-after-free bugs into two parts (well three actually, but more about that later). The first part of the algorithm is to decide at a free call what memory locations and registers we want to consider free’d. We want to know all variables that contain pointers to the memory location about to be free’d so that we can consider a use of any of these variables to be a bug.

The most common theoretical framework for this problem is called use-def analysis and is common in compiler theory. In such an analysis we take a variable use (e.g. the push of whatever variable is to be free’d) and compute all its definitions at that point by traversing backwards over all paths to that point. We then want to apply this function recursively over all the definition variables we have found, treating them as uses. By modifying the standard use-def algorithm we can do this to find all variables equivalent to the free’d variable.

In my implementation as I traverse the paths backwards from a free call to find definitions I maintain a list of all locations that are used as destination operands in instructions i.e. they are rewritten before the free call. I will refere to this as the clearedVars list. So, if we are looking for the definition of a variable x and it is found at an instruction mov x, y; we know y is equivalent to the free’d variable if and only if y is not a member of clearedVars. Regardless of whether y is in clearedVars or not we then apply our use-def algorithm to find its definitions with the same considerations. This iterative approach is continued until all paths leading to the free call have been analysed and we are left with a set of variables equivalent to the argument to free.

The following snippet of Python code will hopefully help the explanation. It shows the logic applied to the destination operand of a mov instruction.

if dst in state['needDefList']:
    src = insDataFlow.getSrcFor(dst)
    state['needDefList'].append(src)
                    
    if src not in state['clearedVars']:
        if src not in self.equivVarList:
            self.equivVarList.append(src)
    
    state['needDefList'].remove(dst)
    state['clearedVars'].append(dst)

When finding the set of equivalent variables we can generally avoid many sources of false positives in static analysis by accepting false negatives. The main source of false positives I encountered (that weren’t caused by my lack of coding talent) derived from considering paths with unsatisfiable conditions.

So at this point we have an algorithm for computing a set of equivalent variables given a starting point and a source variable. In case it isn’t obvious, I should point out that the equivalent variables along each path should be stored separately. Otherwise it becomes an avoidable source of false positives in the next part of our algorithm.

Finding use-after-free instances

Most of the work for this algorithm is in the previous stage. Once we have computed the equivalent variables per backwards path we are ready to look for uses of these variables in an unsafe context. We also use the data flow information from each instruction to add/remove variables from the set of locations we consider to hold pointers to free’d memory.

For use-after-free vulnerabilities I considered unsafe use to be any instruction that used the free’d pointer in the computation of a memory address. (I also extended eventually this definition to include any instruction that pushed a free’d pointer to the stack). Checking for such a condition is relatively simple. For each instruction we just iterate over all base registers used in computing the pointer and determine if it is in the set of variables we know to hold free’d pointers or not.

def checkInsForFreeVarUse(self, ea, dst, src, state):
    for op in (dst, src):
        if isinstance(op, TaintLoc_MEMREF_REGS):
            # Usage e.g. mov [ebp+10], eax; and ebp is a free'd var
            for usedReg in op.regs:
                if usedReg in state['freedVars']:
                    self.b00m(ea, usedReg)

In my code the TaintLoc_MEMREF_REGS class represents an operand that is a memory location constructed using at least one register. The objects src and dst are the source and destination operands for a given instruction (a single source and destination suffices for the instructions instrumented in this case).

That is basically the bones of an algorithm that can operate within the bounds of any function containing a call to free; this is useful in its own right but as I thought about it I began to consider cases where a function may free one of its arguments. This could be a problem in two ways: 1) The programmer using the API call is unaware of this functionality, or forgets, or 2) The function should not free the argument and that it does is a flaw in its implementation. The latter case is more interesting in my opinion but the same approach will detect both.

Function aliases and interprocedural analysis

There is probably some other name for what I’m about to describe but let’s call it a ‘function alias’ for now. True interprocedural analysis of a function f containing a call to free would involve relatively complex analysis of the relationship between non-local variables in f and the variables defined at the call sites of f. Doing this properly is non-trivial but we can perform a more limited analysis with much less effort.

The type of interprocedural analysis I implemented begins with searching for aliases to the API call that we are using as the starting point for our algorithms. For use-after-free bugs this is the free function. Let us consider this trigger function as a tuple (f, n), where f is the function in question and n is the argument we consider to be free’d or closed or whatever the action we are interested in happens to be. An alias for a function (f, n) is then a function (g, m) such that calling the function g with the variable x as argument m results in a call to f with x as argument n. If we are provided with one or more aliases for (f, n) we can then apply the exact same analysis algorithm as described in the previous sections to find interprocedural bugs.

The question then becomes how do we build such a list? The answer is pretty simple at a high level – say we are in a function g and analysing a call to the function f that free’s its nth argument. Our first algorithm will build the set of variables equivalent to the nth argument to f, let’s call it E. If any of g‘s arguments are in this set then we know (g, m) is an alias for (f, n) where m is the index of that variable. The only tricky part of this is tracking the function arguments to g. IDA takes care of this for us and renames memory locations automatically using an identifier similar to arg_X but if using another framework you may have to do that yourself. (This turns out to be trickier than you might think, a description of how the simplex method is used in IDA can be found here.)

Righty, so at this point we can take any function and compute its aliases. For maximum fun we apply this recursively to find aliases for aliases and so on, applying our basic analysis algorithms to each discovered alias in turn.

That basically sums up the details of my approach. I used it to look for use-after-free bugs but with varying amounts of effort it could be changed to look for all sorts of fun stuff.

Testing

I tested my implementation (~850 lines of Python using IDAPython as a framework) on libxml2, which has a history of use-after-free bugs, Clam Antivirus, which has a history of sucking and TightVNC, because the name makes me giggle.

The following table summarises the results of my rather brief and unscientific testing.

Analysis results
Analysis results

Both libxml2 and Clam AV came up good for a few bugs each and multiple aliases for free. Some of these aliases were obviously on purpose with names like cl_engine_free, whereas others were more difficult to determine. All three results found in Clam AV were as a result of analysis on an alias function so it is possible that this function has unintended side effects. For libxml2 the bugs were split, two resulting from direct calls to free and two resulting from a call to an alias function. Despite its giggle inducing name, TightVNC showed no bugs and, disappointingly, not even an alias to free. For both libxml2 and Clam AV the false positives were as a result of paths with unsatisfiable conditions.

Conclusion

In the above table I’ve purposely used the term ‘bugs’ instead of ‘vulnerabilities’. The reason for this is the same reason that I’ve now moved on to investigating hybrid dynamic/static implementations. Finding a bug using static analysis of the type I have described gets you a location in a binary where some broken coding idiom occurs. This is useful in its own right and all valid bugs detected during my testing are concrete paths leading to use of a dangling pointer.

From an offensive point of view we must consider the issue further though. Without more analysis you have no idea how to trigger this code or even if it is triggerable in a malicious fashion. In fact, as soon as you get over the initial rush of ‘oh look, a shiney new bug’ you quickly realise you have a mountain of work to actual exercise that code, let alone craft an exploit. From a defensive point of view none of this really matters, the code is incorrect regardless and should be fixed but from an exploit writers point of view discovering the bug in this fashion merely puts your shoes on. You still have a marthon to run in order to get to an exploit.