Finding 10x+ Performance Improvements in C++ with CodeQL – Part 2/2 on Combining Dynamic and Static Analysis for Performance Optimisation

In the previous post I advocated for building systems that combine static and dynamic analysis for performance optimisation. By doing so, we can build tools that are much more useful than those focused on either analysis approach alone. In fact, for many static analyses it’s likely that the difference between being useful at all and not so, is whether or not it’s combined with a profiler. As an example, continuous profiling can gather information on the hottest code paths in production environments, and this can be used to rank the output of the static analysis. A developer can then focus their efforts on the most important findings. This minimises the time wasted due to false positives, or unimportant true positives, from the static analysis. Conversely, static analysis can be used to provide further context on the output of continuous profiling and make its results more actionable, such as suggesting why a particular function may be hot, or suggesting potential optimisations.

In the previous post also I outlined a trivial-but-very-effective combination of analyses, in which the Top N most expensive functions identified by continuous profiling are piped into a service that checks library and function names against a list of known faster replacements, allowing a developer to optimize their application with zero code changes. e.g. swapping jemalloc for libc malloc, zlib-ng for zlib, orjson for Python’s stdlib JSON etc.

In this post we’re going to go deeper, with a static analysis that actually looks at the application’s code. When I started thinking about combinations of analyses for performance optimisation, I didn’t find much in the way of off-the-shelf static analyses that I could just use. So, I decided to build my own. We’re going to try and answer the question: can we use static analysis to find C/C++ code patterns that lead to sub-optimal machine code being emitted by the compiler?

I’ll first describe a particular code pattern that can lead to the compiler emitting unnecessary memory reads, and failing to auto-vectorise loops. When these patterns exist they can lead to functions being 10-20x or more slower than they otherwise could be. I’ll show how we can build CodeQL queries to find the patterns, and how we can modify the code to allow the compiler to auto-vectorise. I’ll then discuss results of applying the queries to a few code bases, lay out some issues that arise, and detail some potential future work and open questions.

CodeQL

CodeQL allows you to write queries in a declarative object-oriented language, and apply those queries to a codebase that has been converted into a relational representation in a database. In other words, it provides a relatively easy-to-work-with query language for finding interesting patterns in code. Typically it is used in the security space for bug hunting. From a vulnerability hunter’s point of view CodeQL provides a relatively unique and powerful capability for a static analysis tool. Existing static analysis tools (Coverity, the clang static analyser etc.) encode checks for common vulnerability patterns, but by virtue of the fact that these very tools are part of the toolbox of many software developers, and the fact that trivial overflow patterns are less and less likely to make it through modern QA, such analysers aren’t particularly helpful for a vulnerability hunter. For this reason, and others, static analysis by and large does not have a great reputation amongst people interested in finding exploitable software flaws. By allowing one to conveniently encode arbitrary patterns and search for them in a database, CodeQL enables “variant analysis”, i.e. searching for variations of a given bug in the same codebase, or a new codebase. This turns out to be a fruitful way of finding security vulnerabilities. As of yet CodeQL hasn’t seen any use that I’m aware of in the realm of detecting performance issues, but its flexibility makes it an excellent candidate technology for any property that can be encoded as predicates over an abstract syntax tree.    

The Inconveniences of Type Aliasing in C/C++

In Optimising an eBPF Optimiser with eBPF I discussed searching for performance improvements in a program synthesis engine. One of the optimisations I made was to modify the code to allow the compiler to auto-vectorise a series of very hot loops which looked as follows:

Under the hood, a std::vector<bool> has some properties that mean the loops cannot be auto-vectorised. See the post I just mentioned for details, but in short: we needed to replace std::vector<bool> with a vector of something other than a bool. The original something that I chose was a uint8_t but, to my surprise, instead of getting out a nicely unrolled and vectorised loop, what I got was this:

The compiler has generated code that on each iteration of the loop loads the source and destination pointers from [r12] and [rbx+0xa8], and thus it cannot auto-vectorise. I eventually tracked down the issue with the help of this post by Travis Downs. The problem is type aliasing. In C/C++, the char type (and its kin, such as uint8_t) can alias every other type. On a write to memory through such a type the compiler has to assume that it may have modified any other heap-based memory location, even if that location has an entirely different type (such as the data pointers contained in the source and destination vectors in the above example). Because of this, in the above example, the compiler must assume [r12] and [rbx+0xa8] could have been modified by the write to [rdx+rax] and therefore cannot safely auto-vectorise the loop as it needs to reload these values after each write.

In many situations, having to reload a value from memory is not the end of the world, but in the context of loops in particular the issue can lead to drastically worse code being generated by the compiler than would otherwise be possible. In Travis’ blog post he shows a particularly pathological example where the issue leads to code that is 20x slower than it could be. 

There are a variety of ways to fix this ‘problem’. Where possible, replacing the uint8_t/char type with a char8_t will solve it. The char8_t type, introduced in C++20, does not have the aliasing issue that char does. If C++20 cannot be used, and switching to some other wider primitive type is not reasonable, then another option is to try and lift any code that requires a load from memory out of the loop. For simple code this can be straightforward e.g. lifting an access to the size() attribute of a vector out of the loop condition, to before the loop. However, for larger, more complex loops, this can quickly become infeasible and one can be stuck with accepting the overhead of unnecessary memory loads due to type aliasing.

Searching for Aliasing Writes

Our goal is to build a query that will find patterns in code whereby, due to writes through aliasing types, the compiler is generating loads from memory that we know are unnecessary. Lets begin by describing at a high level what we are looking for.

What we want to search for a sequence of code which looks like:

  1. A load from memory through an expression X, where X denotes a memory location. e.g. X may be of the form *a, a[i], *(a+i) etc.
  2. Followed by a write through an aliasing type, such as a char
  3. Followed by a load from memory through X, such that none of the components of the expression X have been modified since step (1). e.g. if the expression X is *(arr+i) then we require that both arr and i have not been modified. If they have been modified then the compiler would need to emit another load from memory, regardless of the write through the aliasing type.

At a glance, this seems like a fairly easy set of properties for a static analyser to match on. We won’t worry about reasoning across function boundaries (although we will handle inlined functions), and each property can be expressed as a syntactic predicate on an AST. 

In the following examples the code marked as [1], [2], and [3] correspond to items 1, 2 and 3 in the above list.

The above pattern will match a straight-line sequence like the following:

// glib-2.0/glib/gstring.h
static inline GString*
g_string_append_c_inline (GString *gstring,
                         gchar    c)
{
 if (gstring->len + 1 < gstring->allocated_len) // 1
   {
     gstring->str[gstring->len++] = c; // 2
     gstring->str[gstring->len] = 0; // 3
   }
 else
   g_string_insert_c (gstring, -1, c);
 return gstring;
}

Here [1] marks the first load from memory via the the read of gstring->len, [2] marks the write through the aliasing type via the write of c into gstring->str, and [3] marks the second read via the read of gstring->len again. Due to [2] the compiler is forced to generate a second load of gstring->len at [3] although we can see that the write at [2] cannot impact it, and the value could have been stored in a register and reused . In fact, the write through the aliasing type results in two extra reads from memory here, as on part [3] the compiler not only has to reload gstring->len but also gstring->str. You can view the assembly produced for this on Compiler Explorer.

The pattern will also match slightly more complex loops such as:

// tesseract/src/classify/adaptmatch.cpp
     for (unsigned id = 0; id < templates->NumClasses; ++id) { // 1,3
       int font_set_id = templates->Class[id]->font_set_id;
       const FontSet &fs = fontset_table_.at(font_set_id);
       for (auto f : fs) {
         const Shape &shape = shape_table_->GetShape(f);
         for (int c = 0; c < shape.size(); ++c) {
           if (char_norm_array[shape[c].unichar_id] < pruner_array[id]) {
             pruner_array[id] = char_norm_array[shape[c].unichar_id]; // 2
           }
         }
       }
     }

(Here [1] and [3] mark the first and second loads of templates->NumClasses, while [2] marks the write to pruner_array which has type uint8_t*. There are actually several other values that must be reloaded from memory in this example due to the aliasing write, not just templates->NumClasses.)

The pattern we have described matches not just the outermost loop above, but also the innermost loop on line 7, as shape is a vector and the call to the size() function will be inlined.

// tesseract/src/classify/adaptmatch.cpp
         for (int c = 0; c < shape.size(); ++c) { // 1,3
           if (char_norm_array[shape[c].unichar_id] < pruner_array[id]) {
             pruner_array[id] = char_norm_array[shape[c].unichar_id]; // 2
           }

On each iteration of the loop the size of the vector will be unnecessarily reloaded due to the write at [2].

To bring these examples full circle, lets actually make the change required to remove the aliasing issue. Jumping back to the glib example, the original version can be found on Compiler Explorer here and the optimised version (in which we replace the char type with the C++20 char8_t type) can be found here. Below, the original is on the left, and the version using char8_t is on the right.

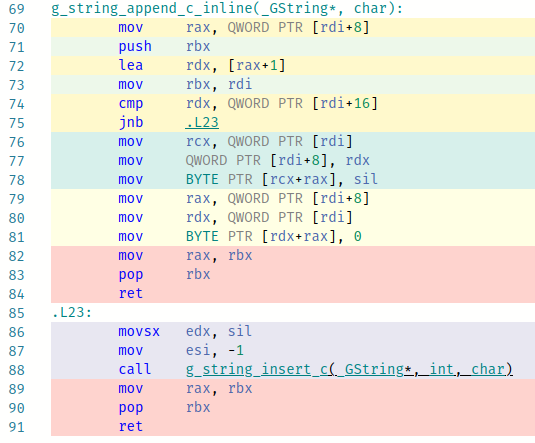
In the original, lines 79 to 81 correspond to gstring->str[gstring->len] = 0. The rdi register points to the GString structure, with the pointer to the string at offset 0 and the length at offset 8. We can see that the compiler has emitted code to load both from memory due to the write on line 78 which it must consider as potentially aliasing with the internals of the GString object. In the optimised version using char8_t we can see that the compiler has not had to worry about the aliasing write, and has generated a single instruction for this line of code: line 78. This instruction reuses the string pointer and string length which were previously loaded into rcx and rax.

In conclusion, we have a pattern we can describe in plain English to find a code pattern, and we have evidence that if we can find such a code pattern then we can make trivial changes that may enable the compiler to emit more efficient code. Lets now move onto building CodeQL queries to automate the search for this pattern.

CodeQL Queries to Find Aliasing Writes

What we are searching for is conceptually very simple: two loads from memory, with a write through an aliasing type in between. The easiest part of this to express in CodeQL is the write, which looks as follows (I’ve put all the CodeQL queries we’ll build in this repository, and this sample can be found here):

predicate isMemCharWriteExpr(Expr e) {
   exists(AssignExpr a, Expr lval |
     a = e.(AssignExpr) and // A
     lval = a.getLValue() and
     lval.getType().stripType() instanceof CharType and	// B
     (
       lval instanceof PointerDereferenceExpr or // C
       lval instanceof ArrayExpr or // C
       lval instanceof OverloadedArrayExpr // C
     )
   )
}

This predicate returns true if the expression passed to it matches “an assignment expression (A), in which the lvalue has a character type (B) and the lvalue is a pointer dereference, array expression or overloaded array expression (C)”. We can immediately see here that expressing an assembly level concept like “a read from memory” requires us to enumerate the C/C++-level syntactic constructs that we think may produce such assembly. This has the potential to introduce both false positives and false negatives. It will also result in our queries being quite verbose, even though in natural language we can concisely express the properties we want to match on. 

The increment and decrement operators can also result in a write to memory, (e.g. v[x]++), so our predicate must also account for those. They can be handled in a similar manner to assign expressions, so for brevity I have not presented that part of the query here, but you can find the full predicate here on Github.   

We next need a way to match against C/C++ code that we think will produce loads from memory with the properties that we outlined as item 1 and item 3 in the sequence that we are after. For this, we need to construct a query which matches two expressions in the same function that will result in a load from memory, where in theory the compiler could cache the result of the first load in a register and reuse it in the second load, if it weren’t for the intervening write through the aliasing type. There are a few different syntactic constructs in C that may result in a load from memory. We could have: 

  • An array expression, e.g. x = array[offset]
  • A pointer dereference, e.g. x = *ptr
  • A pointer field access, e.g. x = ptr->val

Alongside these we also have the possibility that functions that result in memory reads can be inlined, e.g. the vector size() function. 

The query implementation for finding code patterns that involve array expressions, pointer dereferences and pointer field accesses are all fairly similar, so I will just walk through the one for pointer field accesses here (found here on Github, with the helper functions here). A pointer field access consists of something like base->field. In the following code, a1 represents our first memory access, w represents the write to memory through the character type, and a2 represents our second memory access.

from
 Expr w,  PointerFieldAccess a1, PointerFieldAccess a2, Variable baseVar
where
 (
   isMemCharWriteExpr(w) and // [1]
   // Sequence of execution is a1 -> w -> a2
   a1 = w.getAPredecessor+() and // [2] 
   w = a2.getAPredecessor+() and // [2]
  
   baseVar = a1.getQualifier().(VariableAccess).getTarget() and // [3]
   // Assert that a1 and a2 use the same base pointer
   baseVar = a2.getQualifier().(VariableAccess).getTarget() and // [3]
   // Assert a1 and a2 access the same field in the struct
   a1.getTarget() = a2.getTarget() and // [4]


   // Eliminate cases where the variable holding the base pointer is modified
   not exists(AssignExpr redef | // [5]
       redef = a1.getASuccessor+()
       and redef = a2.getAPredecessor+()
       and redef.(AssignExpr).getLValue().(VariableAccess).getTarget() = baseVar
   )
   // Further cases here to eliminate things like increments, redeclarations etc
   ... 
 )
select a1.getLocation().getFile().getBaseName(), a1.getLocation().getStartLine(), a1, w, a2, baseVar
  1. We begin by passing the write expression w to our predicate to assert that it is a write of a character type that will result in a memory dereference
  2. We then assert the ordering of our three expressions, namely that a1 comes before w which comes before a2
  3. We need to get the base variable from base->ptr so we can later make assertions on it. We extract it from a1 and assign it to baseVar, and then also assert that a2 makes use of the same base variable. While this might look like we are assigning something to baseVar and then immediately overwriting it, remember that this is a declarative query language, not an imperative one. We are stating that baseVar equals two things, therefore they must be the same. 
  4. We also need to assert that the field accessed is the same at a1 and a2
  5. Finally, we specify that between a1 and a2 the baseVar has not been modified. The case above specifies that there are no assignment expressions between a1 and a2 where the lvalue is the base variable. In the full query we also handle a few other ways that the base variable might be modified.

And that’s it! This query, and the similar ones for pointer dereferences and array expressions, are sufficient to find the patterns we’re looking for. It will find them in both straight-line sequences of code and in loops. As presented, these queries operate in a scope that is local to a single function. They won’t find cases where the memory access results from a call to an inlined function, such as vector.size(). In the next section I’ll show how we can deal with that scenario, as it is necessary in order to detect inlined function calls in loop conditions, which is a productive source of the sorts of memory accesses we are searching for.

Finding Inlined Memory Accesses in Loop Conditions

A common source of memory loads that meet our requirements are loads behind an inlined function call in a loop condition, e.g. something that checks the size of a vector, such as for (i = 0; i < vector.size(); i++). We could modify our existing queries that search for two memory accesses with an intervening aliasing write, as they are generalisations of the case of a loop condition containing a memory access and an aliasing write within that loop body. However, one lesson I’ve learned with CodeQL is that it’s often easier to build queries for exactly what you have in mind and later generalise if necessary. Premature generalisation can lead to overly complex queries that are difficult to debug, and prone to both false positives and false negatives. Starting with a concrete example, then generalising if necessary, has generally proven to be a better strategy.  

A concrete example of what we wish to find is:

void vector8_inc(std::vector<uint8_t> &v) {
   for (size_t i = 0; i < v.size(); i++) {
       v[i]++;
   }
}

So, we want a loop in which:

  1. The condition has a call to an inlined function that results in a memory access, and
  2. There is a write to memory within the body of the loop. 

The CodeQL query to express this begins as follows:

from Loop l, Expr w 									
where
 // The loop condition accesses memory in some way
 loopConditionAccessesMemory(l)							
 // And the loop contains a character-write expression
 and isMemCharWriteExpr(w)								// [1]
 and w.getEnclosingStmt().getParentStmt*() = l.getStmt()			// [2]
select l.getLocation().getFile().getBaseName(), l.getLocation().getStartLine(), l, w

The write-to-memory part is handled in the same manner as our earlier queries via isMemCharWriteExpr [1], and we add the requirement that the write expression is inside the loop [2]. loopConditionAccessesMemory is the predicate we’ll use to find loop conditions that either access memory directly or call an inlined function that does so (the query contents found here, with most of the functionality in helpers found here on GitHub). It looks as follows:

// Returns true if the loop condition contains a function call that we think will
// result in a memory access.
predicate loopConditionAccessesMemory(Loop l) {
 exists(FunctionCall funcCall, Function func |
   funcCall = l.getCondition().getAChild() 	// [1] 
   and func = funcCall.getTarget()
   and func.isInline() 				// [2]
   and allCalleesAreInline(func)			// [3]
   and hasMemoryAccess(func)			// [4]
 )
}

We want a loop condition containing a function call [1] to an inline function [2] that itself only calls other inline functions [3] and that either it, or its callees, contain a memory access [4]. The predicates that check [3] and [4] are recursive, and look as follows:

// Recursive predicate. Returns true if all functions called from this function
// are inline, as are their callees, and so on.
predicate allCalleesAreInline(Function func) {
 not exists (Function called |							// [1]
   (not called.isInline() or not allCalleesAreInline(called)) 		// [2]
   and called.getACallToThisFunction().getEnclosingFunction() = func	// [3]
 )
}

allCalleesAreInline asserts that there are no functions [1] that are called from the current function [3], such that the called function is not inline or it calls any functions that are not inline [2].

// Recursive predicate. Returns true if this function, or any function it calls,
// contains an expression that we think will result in a memory access.
predicate hasMemoryAccess(Function func) {
 // The function contains either a PointerFieldAccess (e.g. this->x) or an
 // implicit access via the this pointer
 exists (PointerFieldAccess pfa | pfa.getEnclosingFunction() = func)		// [1]
 or exists (ImplicitThisFieldAccess itfa | itfa.getEnclosingFunction() = func)	// [1]
 // Or, it calls a function that meets the above properties
 or exists (Function called |							// [2]
   called.getACallToThisFunction().getEnclosingFunction() = func
   and hasMemoryAccess(called))			
}

hasMemoryAccess asserts that this function contains an expression that may produce a memory access [1], or that it calls a function that contains a memory access [2].

Alternatively, instead of building the predictaes to look for any inline function with memory accesses, we could have gone with a more hacky variant and matched specifically on calls to functions with names like “size”, “length” and whatever other functions we think might have the properties that we want. In fact, I did this in the first version of the query, and it does work, with one important caveat. For the curious, that predicate looked as follows:

// Find a loop with a call to vector.size() (or some equivalent) in the condition
predicate loopConditionAccessesMemory(Loop loopCond) {
 exists(Expr funcCall, Function func, string fname |
   funcCall = loopCond.getCondition().getAChild()
   and funcCall instanceof FunctionCall
   and func = funcCall.(FunctionCall).getTarget()
   and func.isInline()
   and fname = func.getName()
   and (
     fname = "size" or fname = "len" or fname = "count" or fname = "length"
     or fname = "begin" or fname = "end" or fname = "rbegin" or fname = "rend"
   )
 )
}

While functional, this may result in false negatives when we fail to predict the custom function names used in a particular project. In C++ codebases, custom inlined accessor functions that appear in loop bounds are quite common. E.g. the get_height function in the following loop header is found by the more complex predicate I showed above, but not by the simplified one that just matches on function names.

for (uint32_t y = 0; y < img.get_height(); y++)

Results & Analysis

In order to run CodeQL queries on a project you need a CodeQL database. Such databases are automatically built for public projects on Github and then hosted on lgtm.com. I picked a few C++ projects from there with the goal of answering the following questions:

  1. Do the queries work at all? With static analysis I’m always mildly afraid that when applied to real world projects I’ll either be drowned in false positives or get no results at all due to an analyser either dying or running forever. So, first I wanted to see if I can actually get a result set in a reasonable amount of time, with a reasonable false positive to true positive ratio. 
  2. For the true positives, can we optimise the code so that the aliasing write is either removed or the code is restructured so that its impact is limited. If so, what sort of performance improvement do we get as a result? 
  3. How, if at all, would this analysis fit into a real development workflow or CI/CD pipeline?

Let’s first start with some concrete examples of true positives found by the analysis.  

Sample Findings

Bitcoin 

The codebase I started with was bitcoin. The queries to find accesses resulting from pointer dereference expressions (PDE) and pointer field accesses (PFA) mostly turned up false positives. There were a few true positives, but they were in straight-line sequences of code and the sort of thing where even if the aliasing write was removed it might save on a single memory access on each function invocation. So, not something I wanted to even consider looking into unless we were really desperate for results! Meanwhile, the Array Expression (AE) query turned up no results at all. Maybe we would end up desperate after all 😉 

However, the query searching for memory accesses in loop conditions (LC) came to the rescue finding a bunch of interesting true positives. I’ll get into more detail in the analysis at the end of the post, but to answer any of you wondering “Why was the LC query successful when the others were not?”, empirically it turns out the sweet spot for this sort of analysis is code that has two properties:

  1. It’s a loop, meaning any redundant memory accesses we remove will be saved on every loop iteration, and not just once.
  2. The loop condition accesses some class attribute, meaning at least one redundant access will be emitted in order to load that value. This access is often behind an inlined function, which the LC query will handle correctly, while the others do not.

Onto the findings …

bech32.cpp bech32::ExpandHRP

The bech32::ExpandHRP function is found in src/bech32.cpp.

/** Expand a HRP for use in checksum computation. */
data ExpandHRP(const std::string& hrp)
{
   data ret;
   ret.reserve(hrp.size() + 90);
   ret.resize(hrp.size() * 2 + 1);
   for (size_t i = 0; i < hrp.size(); ++i) { // 1
       unsigned char c = hrp[i];
       ret[i] = c >> 5; // 2
       ret[i + hrp.size() + 1] = c & 0x1f;		// 2
   }
   ret[hrp.size()] = 0;
   return ret;
}

At [1] we have a call to the size() function of std::string, which will read the length of the string from memory. Then at [2] we have two writes to the memory that is backing the ret variable. ret has the data type, which is just a typedef for std::vector<uint8_t>. While ret itself lives on the stack, the call to reserve will result in a call to new which will allocate space on the heap for its contents. If this were not the case, and the contents remained on the stack then the aliasing write would not be a problem as the compiler could safely assume that the writes to the vector on the stack would not interfere with the contents of hrp. However, due to the reallocation on the heap and the fact that the uint8_t is essentially a char, the compiler must assume that at [2] the writes may update the length of the string hrp. It will therefore generate code to load that value from memory at the head of the loop on each iteration.

It gets worse. To see why, lets look at the assembly generated.

The copy loop generated by clang 13.0.1 (-O3 -march=skylake -std=c++20) is as follows (you can find it on Compiler Explorer here):

.LBB0_15:                               
       mov     rcx, qword ptr [rbx] // A. Load the string contents pointer from hrp
       movzx   ecx, byte ptr [rcx + rax] // B. Load next byte from the string
       mov     edx, ecx
       shr     dl, 5
       mov     rsi, qword ptr [r14] // C. Load the vector contents pointer from ret
       mov     byte ptr [rsi + rax], dl	// D. Write ‘c >> 5’ to vector contents 
       and     cl, 31
       mov     rdx, qword ptr [r14] // E. Load the vector contents pointer from ret
       add     rdx, qword ptr [rbx + 8] // F. Add hrp.size() to contents pointer
       mov     byte ptr [rax + rdx + 1], cl // G. Write ‘c & 0xff’ to vector contents
       inc     rax
       mov     rcx, qword ptr [rbx + 8] // H. Check ‘i < hrp.size()’ 
       cmp     rax, rcx
       jb      .LBB0_15

Both the string variable hrp and the vector variable ret contain data pointers which refer to their contents, and even though we know that these pointers in hrp and ret cannot change due to the writes performed in the loop (nor can the length of hrp) the compiler has to generate loads for these pointers (and the length) after each write to ret. The redundancy is most obvious at [E] where, due to the write at [D], the compiler is forced to reload the value from ret (*r14) that it had just loaded at [C].  

You may be wondering why the compiler is forced to reload the pointer from ret at all, even in the presence of the aliasing write, given that ret itself is stack allocated and should be provably distinct from the writes to the heap. The answer can be found by looking at the link to Compiler Explorer above. Due to C++’s Return Value Optimisation/Copy Elision, the pointer to be used for ret is passed to ExpandHRP by the caller in the rdi register, then moved to r14, rather than being stack allocated and then copied out upon the return. See here for more details. While normally a good thing, this has the downside in this case that the compiler can no longer assume that the writes do not alias with the memory that backs ret

In summary, we end up with 6 loads from memory on each iteration of the loop, when in reality we need just the one to load the byte of data we wish to operate on. The necessity of these loads also means that the compiler is prevented from vectorising the loop. If the pointers and size were guaranteed to be stable during iteration of the loop then it could copy large chunks of data, instead of single bytes at a time. But it can’t. 

So how do we fix it? 

Turns out it’s fairly straightforward: define data as a std::vector<char8_t> (C++20 only) instead of std::vector<uint8_t>, thus eliminating the aliasing issue. The compiler no longer needs to reload data pointers or the source string size, and all going well we should get a nicely vectorised loop. The Compiler Explorer result is here and is as expected. 

The following graph shows the benchmark results for the original versus the optimised example, and varying the input size.

Not bad for a four character change! At 32k input bytes the optimised version is 12x faster than the previous version! In practice, it seems the maximum input length that can reach ExpandHRP in the bitcoin codebase is 90. At this size the optimised version is 2.6x faster, so still quite a nice improvement. 

i2p.cpp SwapBase64

Another result from bitcoin is found in src/i2p.cpp. The SwapBase64 function looks as follows:

std::string orig_SwapBase64(const std::string& from)
{
   std::string to;
   to.resize(from.size());
   for (size_t i = 0; i < from.size(); ++i) { 	// 1
       switch (from[i]) {
       case '-':
           to[i] = '+';				// 2
           break;
       case '~':
           to[i] = '/';				// 2
           break;
       case '+':
           to[i] = '-';				// 2
           break;
       case '/':
           to[i] = '~';				// 2
           break;
       default:
           to[i] = from[i];			// 2
           break;
       }
   }
   return to;
}

As before we have a loop in which the size of a string is used in the loop condition [1] and a series of writes to character types within that loop [2]. In total there are three “unnecessary” loads from memory that take place within the loop, due to the writes. The string size in the loop condition, as mentioned, but also the data pointers for to and from

C++20 comes with the std::u8string type that is the string equivalent of char8_t and does not have the aliasing issue, so we can fix the problem by replacing std::string with std::u8string. Unfortunately, by the nature of the code in the body of the loop, on this occasion auto-vectorisation cannot take place. Instead, we end up with a loop that simply has to do three fewer reads from memory. A Compiler Explorer session with the original and the updated version can be found here. The primary differences are shown in the following code snippets. 

In the first snippet we have the head of the unoptimised version. Line 45 is the head of the loop. On line 48 the destination pointer is loaded, on line 51 the string size is loaded, and on line 54 the source pointer is loaded. This occurs on each iteration of the loop.

In the second snippet we see the same code, but for the optimised version. The only memory accesses are the necessary ones, i.e. the write to memory on line 158 and the read from memory on line 163.

Running both versions over strings from size 8 to 16M (increasing in powers of 8) we get the following:

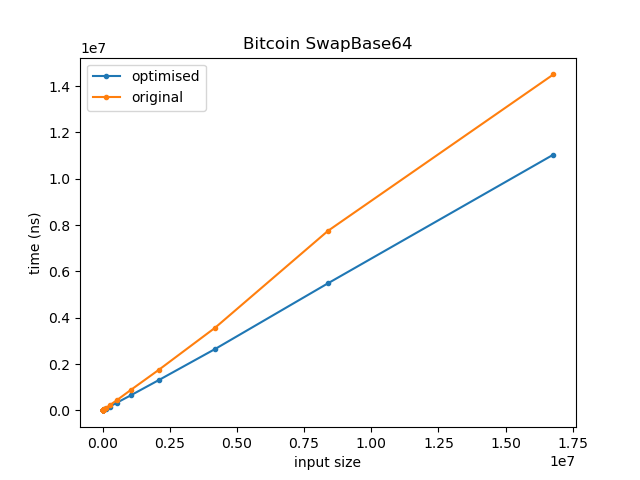
For clarity, the graph of the lower 32k looks as follows:

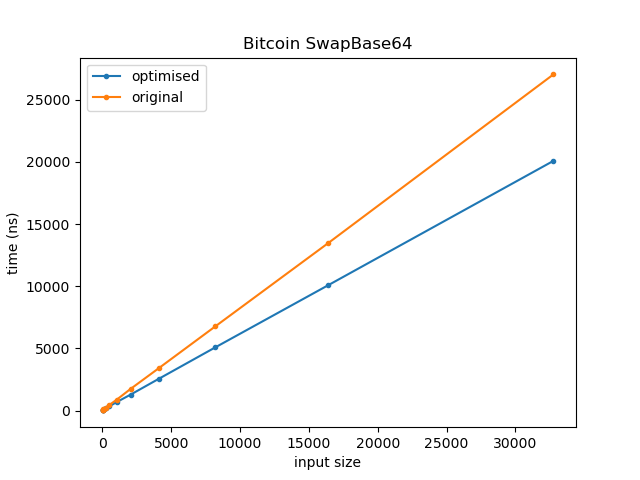
The optimised version executes approximately 63% of the instructions as the unoptimised version, and is on average 1.28x faster.

Monero

The next example comes from the Monero project. By this stage, I had come to the conclusion that the query focused on loop conditions had, by far, the best reward to effort ratio. The others tended to have a much worse false positive/true positive ratio, and require a lot more reasoning in order to distinguish true positives from false positives. The examples that they found also tended to be harder to mitigate in order to fix the issues. 

bulletproofs.cc rct::bulletproof_PROVE

rct::bulletproof_PROVE is found in src/ringct/bulletproofs.cc. It contains a loop that follows a similar pattern to what we have seen so far.

Bulletproof bulletproof_PROVE(const std::vector<uint64_t> &v, const rct::keyV &gamma)
{
 CHECK_AND_ASSERT_THROW_MES(v.size() == gamma.size(), "Incompatible sizes of v and gamma");


 // vG + gammaH
 PERF_TIMER_START_BP(PROVE_v);
 rct::keyV sv(v.size());
 for (size_t i = 0; i < v.size(); ++i)		
 {
   sv[i] = rct::zero();				
   sv[i].bytes[0] = v[i] & 255;			
   sv[i].bytes[1] = (v[i] >> 8) & 255;		
   sv[i].bytes[2] = (v[i] >> 16) & 255;
   sv[i].bytes[3] = (v[i] >> 24) & 255;
   sv[i].bytes[4] = (v[i] >> 32) & 255;
   sv[i].bytes[5] = (v[i] >> 40) & 255;
   sv[i].bytes[6] = (v[i] >> 48) & 255;
   sv[i].bytes[7] = (v[i] >> 56) & 255;
 }
 PERF_TIMER_STOP_BP(PROVE_v);
 return bulletproof_PROVE(sv, gamma);
}

At a glance, this loops like a simple copy loop, for which the compiler should be able to generate assembly which performs all 8 assignments to sv[i].bytes at once. However, as the bytes array has a char type, after each assignment the compiler must generate code to reload several previously loaded values. The resulting assembly looks as follows, with most of the memory reads being unnecessary:

Resolving the issue is straightforward. As before we can simply change the type of the bytes array to be char8_t. With this change the compiler generates the following for the loop body:

As desired, we are now performing all 8 assignments in one go. The performance improvements are as you’d expect. The following graphs time on the y-axis against inputs with sizes in the range 2^6 to 2^14.

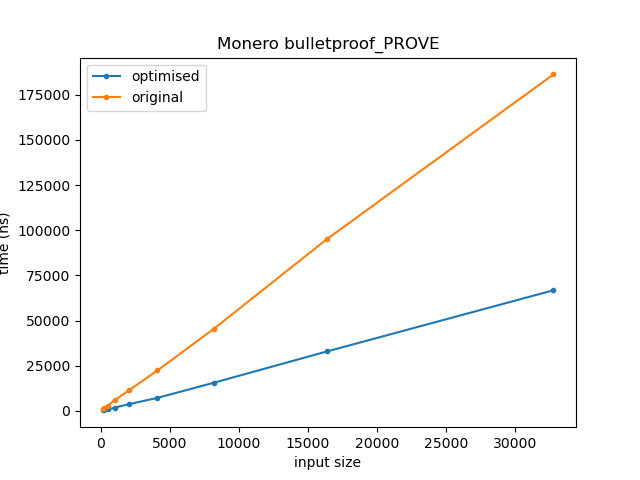
I’m unsure how big the keys used for this function are in reality, but the speedup is around 3-4x for sizes in the range 128 to 8192. 

I think by now the sorts of patterns this approach tends to pick up should be clear, so let’s move on to answer the original questions I set out at the start of this section.

Analysis

The high level questions I had in mind at the start were as follows:

Q1. Do the queries actually work at all? Meaning, can we get a result set in a reasonable amount of time, with a reasonable false positive to true positive ratio.

Yes, the queries work, but there are some important details which I’ll get to in a minute.

Even on larger codebases the total query execution time is typically not more than a few seconds. I haven’t gathered precise numbers on the true positive to false positive ratio due to time constraints, but empirically I would say it is ‘reasonable’. To find the sort of patterns we are looking for it is sufficient to do syntactic pattern matching within functions, so we avoid the need to perform the types of semantic analysis that tend to lead to false positives. Many of the false positives are due to flaws in my queries that could probably be fairly trivially fixed by someone better at CodeQL than me. 

There are a few important notes to be added here. 

Detail #1: The Loop Condition (LC) query is much less prone to false positives than the other queries that are more generic, and has a much better effort-to-reward ratio. It is worth discussing why this is, as the reasons are helpful in understanding the limitations of using CodeQL to hunt for performance issues in general.  By “effort-to-reward ratio”, I mean the effort one must undertake to both triage a finding into true positive versus false positive, plus the effort required to fix the found aliasing issue, versus the reward in terms of the speed-up of the code as a result of fixing this issue. 

The LC query looks for loops that read from memory in their loop condition and also have a write through an aliasing type in their loop body. Alongside these properties, there are a couple of others that, for the sake of brevity I did not go into when presenting this query earlier. They are that it requires that the loop body is linear (no branching), and if there are any function calls then the called function is inline (and recursively any such inline function is also linear, and only calls other inline functions). The reason for focusing on loops without branching is that a true positive means a vectorised alternative is more likely attainable, and the reason for avoiding loops with non-inlined function calls is that quite often in such situations the compiler will generate code to reload values from memory after the function call, even if we remove the aliasing write from the loop. The query containing these extra restrictions can be found here.

So why does the LC query result in fewer false positives, and have true positives that have better performance improvements? The latter is straightforward: since we’re looking at loops, by their nature they execute repeatedly and thus any improvement we find is magnified in comparison to straight-line code. Since we’ve restricted the loop body in various ways there’s also a chance that when we find a loop that matches our pattern it may be vectorisable, or at least that the improvements that we make will be significant in comparison to whatever else is in the loop. Due to the fact that these loop bodies tend to be small, the effort required to determine what changes are necessary to fix the aliasing issue is also usually low. 

As for why the LC query has fewer false positives, again this comes down to the restrictions that we place on the loop body for matching results. We are pattern matching at the source code level, but fundamentally the properties that we care about are patterns over assembly code. Why is this important? Well, our queries describe patterns in source code that we think should result in assembly code that results in “unnecessary” reloads of data from memory. However, the compiler’s optimisation passes are complex and there are a bunch of different things that may result in a value being cached in a register or spilled to memory. Some of these aspects can be captured as syntactic patterns, while others cannot (e.g. register spilling decisions or even minor compiler bugs), and some are situationally dependent, or even compiler dependent. We can therefore have “true positives” that are true in the sense that at the source code level the code does match the pattern we are after, but, despite this, even if we were to remove the aliasing write we would still not get more optimised code that does not contain the “unnecessary” load due to aspects of the surrounding code and the decisions the compiler makes as a result.  

The impossibility of capturing the compiler’s internal reasoning in terms of CodeQL queries means that the more code that is spanned by a finding, from the first load of a value to its later reuse, the more likely it is that in between those points will be something other than the aliasing write that would cause the compiler to have to reload the value anyway, even if we remove the write. The other queries, besides LC, have fewer restrictions and thus tend to span code blocks that are larger and more expressive, and thus have more of these sorts of “false positive” findings where removing the aliasing write does not lead to any benefit. We could of course add the restrictions from the LC query to the other queries, to require linear code and no function calls. This would probably help with the false positives. However, I haven’t bothered to do this as I don’t think these other query types are likely to have a reasonable effort-to-reward ratio, even with this change. As mentioned, the effort to reward ratio is much higher with loops so I think that’s likely where the sweet spot is for this type of analysis. If I wanted to pursue this further, I would put my time into expanding the types of syntactic patterns that match loads from memory in the loop condition, rather than trying to make the more generic queries more usable. 

Detail #2: As the setup for my test was “get some C/C++ codebases and run the queries”, I have no ground truth. Therefore we have no real clue what the false negative rate is. Above, I have argued for the usefulness of the LC query, partially due to the positive effect of the restrictions it imposes on the ratio of true positives to false positives. It’s unlikely this is a free lunch, and my guess is there are loops that have the aliasing issue that we are looking for, but that are excluded by the LC query. I haven’t come across any, but I also haven’t looked. If you happen to find one, let me know. 

Detail #3: I also ran the queries on a few C codebases, namely the Python and PHP interpreters, and the Linux kernel. In these codebases there were some true positives, but none which would have any meaningful impact on the function’s performance were they fixed.

Q2: For the true positives, can we optimise the code so that the aliasing write is either removed or the code is restructured so that its impact is limited. If so, what sort of performance improvement do we get as a result

In short, yes, we can, and the performance gain depends on the nature of what the code is doing. This is mostly answered above, but to restate the most relevant part: it pays to put one’s efforts into triaging results that are likely to have a significant pay off if they are true positives. Loops, in other words. Alternatively, if one has functions that are called a lot, that would fit the bill for the same reason. 

For the more generic queries that did not focus on loops, I found trying to both triage and optimise them to be a painful process for the reasons mentioned in Caveat #1 of Q1. There was often a significant amount of code in between the first load from memory and the second, and trying to reason about whether the compiler will have the need to reload at the second point, even if we remove the aliasing write, was error prone. 

Q3: How, if at all, would this analysis fit into a development workflow or CI/CD pipeline?

We can split this into two parts: inline analysis as the developer is writing code, versus analysis of an entire codebase. In both cases, as with any kind of analysis, the question we are trying to answer is “Will this have meaningful impact, without negatively impacting development velocity or annoying the developers”. However, the actual work a developer may have to do to respond to an alert (in terms of reasoning, coding and validation of results) is drastically different between these two scenarios, and so we need two different modes of operation. 

In the case of a developer writing a new piece of code, if their IDE alerts them to a loop matching the properties we’re looking for, it is likely to be an easy decision as to whether to adjust the code or not. They will have some idea as to whether the code is likely to be “hot”, and what the impact of that may be. As the code is new, there’s no prior version to benchmark against, no resistance is likely to be encountered in the PR review process (again, no previous code being changed), and if the fix is something like “use char8_t instead of char” then the developer is likely to do it as there is no cost to them. In security this is a similar scenario to your IDE alerting you to use of a potentially unsafe function. Even if you know the code will never be reachable via an attacker, you may use the proposed safe version anyway just to shut up the linter and to follow best practices. 

The case of analysing an entire code-base is a bit more tricky. One of the problems with static analysis in security is that if your automated analysis is purely static, it is easy to end up drowning in low/no-impact reports in this scenario. This is why fuzzing is so appealing: assuming you are providing fuzz inputs through the same input interface that an attacker can access, you generally know that each issue found is both a true positive and worth solving. 

For performance issues, we have a similar problem with static analysis: given a result set, we may find it difficult to know where to put our energy in terms of what to first triage, and then fix. We are not likely to have the time to fix everything, and even if we do, the process of validating those fixes and getting them through a PR review may be a significant effort. So, how do we get something akin to fuzzing’s clarity of signal?

Continuous profiling in production will give it to us quite easily. The results of the CodeQL queries can be ranked based on the CPU consumption observed by the profiler in the real world, and the developer’s efforts therefore focused on findings most likely to have meaningful impact.

Conclusion/Open Questions/Future Work

Practical static analysis for performance analysis is a wide open topic. However, regardless of what direction it takes, the best results will be achieved in conjunction with data from continuous profiling. As outlined in the previous post, there are at least three ways to do this combination: context-for-ranking in which continuous profiling is used to rank the output of a static analysis, context-for-operation in which the static analyser requires data from continuous profiling to operate at all, and ranking-for-analysis, in which we have a heavyweight, slow, static analysis that doesn’t scale to an entire codebase, and therefore continuous profiling is used to guide where to target it.

In this post we saw an example of an analysis that requires context-for-ranking from a profiler. Without it, false positives, and the non-negligible effort required to triage, fix and benchmark each finding, means developers will lose patience with the tool after burning their energy on irrelevant findings, even if they turn out to be fixable true positives. A profiler changes this dynamic, ensuring that the developer’s efforts are focused on findings that are most likely to have a meaningful impact on performance.

As for using CodeQL for this sort of pattern matching, the experiments I did for this post were enough to convince me it’s worth investigating further. I found some good results, that lead to meaningful performance improvements, yet at the same time there were some notable misses (the Linux kernel, PHP and Python), and the false positive rate combined with the effort to triage, fix and then benchmark changes, mean I still consider the approach to be “experimental” rather than developer ready. There are two big open questions for me:

  1. What sort of properties can we query for statically? The type aliasing issue is a quirk of C/C++’s type system. Are there other language-level properties we could capture similarly? Are there API usage patterns that lead to performance issues that we can query for? An example that comes to mind is the use of std::vector inside loops that would otherwise be vectorisable. My guess is there are a few such things, but the question is: how often do they occur, and how meaningful are they? Beyond these, in security, we have seen an evolution from looking for language and API specific issues, to looking for patterns that are specific to a particular code-base but tend to be frequently reintroduced and high impact. Would this be worth pursuing in performance as well? i.e. Are there performance bug types that may only be specific to, for example, Firefox, but that repeatedly occur there due to a particular internal API or pattern?
  2. Would it make more sense to do this analysis at the assembly level? Doing so would side-step the problem of having to try and encode how we think source code will be transformed into assembly, and it is the assembly that matters in the end. However, it can be more difficult to implement common static analysis algorithms on assembly, and scaling the analysis may prove more difficult. In reality, I expect both source level and assembly level analysers will be necessary. For many properties, the false positives introduced by working at the source level will either be irrelevant or manageable, and for those properties the convenience of working at a source level is attractive. Some other performance issues (e.g. assembling layout or alignment) can only be discovered by looking at the running binary though, and so a platform for writing and running analysis at this level will be necessary (e.g. Binary Ninja, IDA, Ghidra).

And that’s a wrap. If you made it this far I hope you found it interesting! If you’ve any questions, leave a comment below or you can find me on twitter @seanhn or LinkedIn.

Better Interpreter Fuzzing with Clang

Last weekend I decided to finally put some effort into investigating Clang, the C/C++/Objective-C frontend for LLVM. Clang is interesting as it is not only designed to provide efficient parsing and processing during compilation, but also as a platform for program analysis tools. Other options for static analysis of C/C++ exist e.g. GCC extensions, cscope hackery, and the various things built on top of CIL (e.g. Frama-C). However, Clang is attractive to me as it supports both C and C++, has a very permissive license, includes a well designed, extensive and documented API and is itself written in C++ (which might be a negative point depending on your view of the world but I like it :P). It also appears to have the backing of both Apple and Google, with a number of their engineers contributing regularly to both LLVM and Clang. All in all, it feels like a maturing project with a skilled and active community behind it.

Clang supports three approaches to writing analysis tools. Using libclang is the encouraged method for most tasks and is probably what you’re looking for if all you want to do is iterate over ASTs and pull out data. The next option is to write a plugin for Clang to be run during the build phase of a project. This is slightly more involved and doesn’t have the benefit of allowing you to use a Python/whatever wrapper around the API. However, if you want to do things like automated source rewriting, or more involved static analysis as part of a build, then this is where you want to be. The final approach is using libtooling. I haven’t looked into writing anything based on this yet but it appears to offer the benefits of writing a standalone tool provided by libclang with the power of full AST control offered by a plugin. The only potential downsides, in comparison to libclang, that I can see are that you cannot write your code in a higher level language and it does not have access to as convenient an API.

After a bit of digging around in documentation and source, I think libclang offers the most gentle introduction to Clang as a program analysis platform. It’s not as powerful as the other two methods but has a stable API (check out include/clang-c/Index.h for the C interface and bindings/python/clang/cindex.py for the Python bindings) and supports a nice visitor based approach for writing tools that traverse an AST. From reading over the above code, and following Eli Bendersky’s introduction to using the Python bindings, you should be able to get up and running fairly easily. As a side note, libclang has progressed somewhat since that blog post so the limitations related to missing cursor kinds are now largely alleviated. There are still some missing features but we’ll get to that later.

A relevant question about now is probably “What the hell has all of that got to do with interpreter fuzzing?”. In general, not a whole lot =) However, when trying to think of some small problem I could tackle to get a feel for libclang I recalled an issue I previously encountered when fuzzing PHP. When fuzzing an interpreter there are typically two high level stages that are somewhat unique to interpreter fuzzing; 1) Discover the functions you can call and 2) Discover how to correctly call them e.g. the number and types of their arguments.

In this regard, PHP is a slightly easier target than say, Python or Ruby, because on the first point it has a lot of global functions that can be called without instantiating a class or figuring out what module to import. These functions can be easily discovered using get_defined_functions. Using this approach it is simple to enumerate a fairly large attack surface that calls directly into the C backend (somewhere upwards of 500 functions in a default configuration) and get fuzzing.

Point 2 remains a problem however. Each PHP function implemented in the C backend takes a number of typed parameters. Some type conversion can and does take place, which means you can specify a boolean when an int is required or other such things. Naturally, there are some types that are completely incompatible, e.g. a function callback is required and you provide an integer type. If you get this wrong the function will bail out without performing any further processing. As well as incorrect argument types, specifying an incorrect number of arguments will also often result in the function execution terminating before anything interesting happens. Precise implementation details can be found in the zend_parse_va_args and zend_parse_arg_impl functions of Zend/zend_API.c.

When fuzzing PHP we are then left with a bit of a conundrum. We can easily discover a substantial attack surface but we still need to figure out the types and number of arguments that each function expects. One solution is to just play a numbers game. Fuzzing an interpreter is fast… really fast. It is also easily distributed and instrumented. So, if we just guess at the types and parameters we’ll probably be correct enough of the time [1]. This has a slight issue, in that there is going to be a bias towards functions that take a smaller number of arguments for purely probabilistic reasons. An improvement is to just parse the error messages from PHP which give an indication as to why the function bailed out e.g. incorrect types or incorrect number of arguments. This is all kind of ugly however and it would be nice if we could just know up front the correct argument types and the exact number required.

Enter Clang! An efficient solution for this problem is simply to parse every C file included in the PHP build, find all calls to zend_parse_parameters, extract the format string that specifies the arguments and their types and then relate this information back to the function names discovered via get_all_functions. It’s a fairly straightforward task on the PHP code base and could probably be achieved via regular expressions and some scripting. That said, using libclang we can come up with a much tidier and less fragile solution. Before I delve into the solution I should mention that I’ve uploaded the code to GitHub under the name InterParser, minus the fuzzer, should you want to try it out for yourself, extend it or whatever.

I’ll explain the code using questions for which the answers were not immediately obvious from the Clang documentation or are things that were interesting/surprising to me.

How do I run my libclang based tool on all files in a build?

The solution to this is also a solution to the next problem so I’ll deal with it there!

How do I know the correct compiler arguments to use when parsing a file?

The clang_parseTranslationUnit of Index.h allows you to specify the arguments that would be passed to the compiler when parsing a particular source file. In some cases it is necessary that you specify these arguments correctly or the code that is parsed will not accurately reflect the code that is included when you run make. For example, if a chunk of code is enclosed within #if BLA / #endif tags and BLA is supposed to be defined, or not, via the compiler arguments then unless you provide the same argument when creating the translation unit the code will not be parsed.

This problem, and the previous one, could easily be solved if we could tell 1) every file processed when make is run and 2) the command line argument passed to the compiler on each invocation. After browsing the Clang documentation for a solution a friend of mine suggested the obvious answer of just wrapping the compiler in a script that logged the relevant information during the build. The script creplace.py provides this functionality. By pointing the CC and CXX environment variables at it you should get a log of all files processed by the compiler when make is ran, as well as the arguments passed.

The ccargparse.py module provides the load_project_data function which you can then use to build a Python dictionary of the above information. If there’s an inbuilt Clang API to do all this I didn’t find it [2], but if not you should be able to just drop in my code and work from there! See the main function of parse_php.py for exact usage details.

Once the compiler arguments have been extracted and converted to a list they can just be provided to the index.parse method when constructing the translation unit for a given file. e.g.

comp_args = load_project_data(cc_file)
args = comp_args[file_path]
index = clang.Index.create()
tu = index.parse(file_path, compiler_args)

How do I find all functions within a file?

Our first task is to find all calls to zend_parse_parameters and note the name of the top level backend API function so that we can later relate this to a user-space PHP function call. To do this we first need to find all function declarations within a translation unit for a source file. e.g the process_all_functions method:

for c in tu.cursor.get_children():
    if c.kind == clang.CursorKind.FUNCTION_DECL:
        f = c.location.file
        if file_filter and f.name != file_filter:
            continue
        fmt_str = process_function(c)

This is a fairly simple task — we iterate over all children of the top level translation unit for the given source file and compare the cursor kind against FUNCTION_DECL, for a function declaration. It’s worth noting that the children of a translation unit can include various things from files that are #include‘d. As a result, you may want to check the the file name associated with the location for the child is the name of the file passed to index.parse.

How do I find all calls to a particular function?

For each function declaration we can then iterate over all of its children and search for those with the kind CALL_EXPR. This is performed in the process_function method. Firstly, we need to check if the function being called has the correct name. The first child of a CALL_EXPR AST node will represent the function itself, with the rest representing the arguments to this function.

The last statement isn’t quite correct. The C and C++ standards specify a number of conversions that can take place on a function call, so the direct children of a CALL_EXPR AST node will represent these conversions and then the direct child of these conversion nodes will contain the details we require. Clang does have a mode to dump the AST for a given source file so if you’re curious what the AST actually looks like try passing -ast-dump or -ast-dump-xml as parameters to the clang compiler.

As an example, on a function call we encounter a CALL_EXPR node and its first child represents the decay of the function to a pointer as specified by the C/C++ standards. This node will have the kind UNEXPOSED_EXPR. It will have a single child of type DECL_REF_EXPR from which we can retrieve the function name via the displayname attribute. The following code in process_function performs the function name extraction and comparison.

if n.kind == clang.CursorKind.CALL_EXPR:
    unexposed_exprs = list(n.get_children())
    func_name_node = get_child(unexposed_exprs[0], 0)
    if func_name_node.displayname == "zend_parse_parameters":
        ...

How do I extract the parameters to a function call?

Once we know we have the correct function call we then need to extract the format string parameter that provides the type specification for the user-space API call. As with the node representing the function, arguments may also undergo conversions. The second argument to zend_parse_parameters is the one we are interested in, and it is usually specified as a string literal. However, string literals undergo a conversion from an rvalue to an lvalue. To account for this, we again go through an UNEXPOSED_EXPR node representing the conversion to access the node for the string literal itself.

Things get a little inconvenient at this point. Once we have the node representing the string literal we ideally want some way to access the actual value specified in the source code. It turns out that this functionality hasn’t been added to the Python bindings around libclang yet. Fortunately, a guy by the name of Gregory Szorc has been working on a branch of libclang and the associated Python bindings that adds the get_tokens method to AST nodes. His code is great but also contains a bug when get_tokens is called on an empty string literal. Until that gets fixed I’ve mirrored his cindex.py and enumerations.py files. Drop both into your clang/bindings/python/clang directory and you should be good to go!

The actual code to extract the string literal given the node representing it is then straightforward.

if tkn_container.kind != clang.CursorKind.STRING_LITERAL:
    raise VariableArgumentError()

tokens = list(tkn_container.get_tokens())
if tokens[0] is None:
    return ""

The check on the kind of the node is required as in a miniscule number of cases the format string parameter is passed via a variable rather than directly specified. This situation is so rare that it isn’t worth handling. The only other slightly odd thing is that when get_tokens is called on an AST node representing a string literal, like the first parameter in func("xyz", a), it will return a generator for two elements. The first will be the string literal itself, including the double quotes, while the second will represent the comma separator. I’m not sure if this is a bug or not but it’s not a big deal. If the string literal is empty then the generator will return None.

Conclusion

At this point we can associate the functions calling zend_parse_parameters with the format string passed to that call, and thus the types and number of arguments that the function expects. In a fairly small amount of Python we have a robust solution to problem 2, discussed earlier. A question you may have is How do you then associate the function name/argument specification from the C code to the corresponding user-space PHP function?. Well, PHP is nice in that it doesn’t do a massive amount of name mangling and consistently if we have a user-space function called func_one then the backend C function will be called zif_func_one (in the code it will probably look like PHP_FUNCTION(func_one) but Clang will expand the macro for you).

When parse_php.py terminates it will output something like the following:

INFO:main:API info for 518 functions in 68 files written to php_func_args.txt

Inspecting the output file we’ll see function to type specification mappings:

# /Users/sean/Documents/git/php-src/ext/standard/levenshtein.c
zif_levenshtein ss sss sslll
# /Users/sean/Documents/git/php-src/main/main.c
zif_set_time_limit l
# /Users/sean/Documents/git/php-src/ext/standard/versioning.c
zif_version_compare ss|s
...

This tells us that a user-space PHP script can correctly call levenshtein with two strings, three strings or two strings and three longs. It can call set_time_limit with a single long only. version_compare can be called with two or three strings and so on and so forth. So, with this information at hand we can construct a PHP fuzzer that no longer has to guess at the number of arguments to a function or their types.

Extensions

The most obvious extension of this code that comes to mind is in pulling out numeric values and string literals from comparison operators. For example, say we’re analyzing a function with the following code:

if (x == 0xc0)
    ...
else
   ....

It might be an idea to pull out the constant 0xc0 and add it to a list of possible values for numeric input types when fuzzing the function in question. Naturally, you’ll end up with extra constants that are not compared with the function inputs but I would guess that this approach would lead to some gain in code coverage during fuzzing.

Resources

Introduction to writing Clang tools
Eli Bendersky’s blog post on parsing C with libclang
Unofficial Clang tutorials

[1] This is what I did when I first fuzzed PHP a long time ago. You hit a lot of incorrect type/argument count errors but you can get so many executions per second that in general it works out just fine =)

[2] Two days after I wrote this it seems that support for the compilation database functionality was added to the Python bindings. You can read about this feature here. Using this feature is probably a more portable way of gathering compiler arguments and pumping them into whatever APIs require them.

Finding Optimal Solutions to Arithmetic Constraints

This post is a follow on to my previous ones on automatically determining variable ranges and on uses for solvers in code auditing sessions. In the first of those posts I showed how we can use the symbolic execution engine of ID to automatically model code and then add extra constraints to determine how it restricts the state space for certain variables. In the second I looked at one use case for manual modelling of code and proving properties about it as part of C++ auditing.

In this post I’m going to talk about a problem that lies between the previous two cases. That is, manually modelling code, but using Python classes provided by ID in a much more natural way than with the SMT-LIB language, and looking for optimal solutions to a problem rather than a single one or all possible solutions.

Consider the following code, produced by HexRays decompiler from an x86 binary. It was used frequently throughout the binary in question to limit the ranges allowed by particular variables. The first task is to verify that it does restrict the ranges of width and height as it is designed to. Its purpose is to ensure that v3 * height is less than 0x7300000 where v3 is derived from width.


int __usercall check_ovf(int width, int height,
    int res_struct)
{
  int v3; // ecx@1

  v3 = ((img_width + 31) >> 3) & 0xFFFFFFFC;
  *(_DWORD *)(res_struct + 12) = width;
  *(_DWORD *)(res_struct + 16) = height;
  *(_DWORD *)(res_struct + 20) = v3;
  if ( width <= 0 || height <= 0 ) // 1
  {
    *(_DWORD *)(res_struct + 24) = 0;
    *(_DWORD *)(res_struct + 28) = 0;
  }
  else 
  {
    if ( height * v3 <= 0 || 120586240 / v3 <= height ) // 2
      *(_DWORD *)(res_struct + 24) = 0;
    else
      *(_DWORD *)(res_struct + 24) = malloc_wrapper(res_struct,
                                       120586240 % v3,
                                       height * v3); // 3
    *(_DWORD *)(res_struct + 28) = 1;
  }
  return res_struct;


If the above code reaches the line marked as 3 a malloc call will occur with height * v3 as the size argument. Can this overflow? Given the checks at 1 and 2 it’s relatively clear that this cannot occur but for the purposes of later tasks we will model and verify the code.

One of the things that becomes clear when using the SMT-LIB language (even version 2 which is considerably nicer than version 1) is that using it directly is still quite cumbersome. This is why in recent versions of Immunity Debugger we have added wrappers around the CVC3 solver that allow one to build a model of code using Python expressions (credit for this goes to Pablo who did an awesome job). This was one of the things we covered during the recent Master Class at Infiltrate and people found it far easier than using the SMT-LIB language directly.

Essentially, we have Expression objects that represent variables or concrete values and the operators on these expressions (+, -, %, >> etc) are over-ridden so that they make assertions on the solvers state. For example, if x and y are Expression objects then x + y is also an Expression object representing the addition of x and y in the current solver context. Using the assertIt() function of any Expression object then asserts that condition to hold.

With this in mind, we can model the decompiled code in Python as follows:


import sys
import time

sys.path.append('C:\\Program Files\\Immunity Inc\\Immunity Debugger\\Libs\\x86smt')

from prettysolver import Expression
from smtlib2exporter import SmtLib2Exporter

def check_sat():
    img_width = Expression("img_width", signed=True)
    img_height = Expression("img_height", signed=True)
    tmp_var = Expression("tmp_var", signed=True)

    const = Expression("const_val")
    (const == 0x7300000).assertIt()
    
    (img_width > 0).assertIt()
    (img_height > 0).assertIt()
    
    tmp_var = ((img_width + 31) >> 3) & 0xfffffffc
    (img_height * tmp_var > 0).assertIt()
    (const / tmp_var > img_height).assertIt()

    expr = (((tmp_var * img_height) &
            0xffffffff000000000) != 0)  # 1
    expr.assertIt()

    s = SmtLib2Exporter()
    s.dump_to_file(expr, 'test.smt2') # 2
    
    # After this we can check with z3 /smt2 /m test.smt2
    # Alternatively we can use expr.isSAT which calls CVC3 but it
    # is a much slower solver

    start_time = time.time()
    if expr.isSAT():
        print 'SAT'
        print expr.getConcreteModel()
    else:
        print 'UNSAT'

    print 'Total run time: %d seconds' % (time.time() - start_time)

if __name__ == '__main__':
    check_sat()


The above code (which can be run from the command-line completely independently of Immunity Debugger) models the parts of the decompiled version that we care about. The added condition, marked as 1 checks for integer overflow by performing a 64-bit multiplication and then checking if the upper 32 bits are 0 or not. The first thing to note about this code is that it models the decompiled version quite naturally and is far easier to write and understand than the SMT-LIB alternative. This makes this kind of approach to analysing code much more tractable and means that once you are familiar with the API you can model quite large functions in very little time. For example, asserting that the condition if ( height * v3 <= 0 || 120586240 / v3 <= height ) must be false translates to the following, which is syntactically quite close to the C code:


tmp_var = ((img_width + 31) >> 3) & 0xfffffffc
(img_height * tmp_var > 0).assertIt()
(const / tmp_var > img_height).assertIt()


Checking if the function does in fact prevent integer overflow is then simple.

Using the solver to check if an overflow is possible on the argument to malloc

So, modulo modelling errors on our behalf, the check is safe and prevents an overflow on the size argument to malloc*. So what now? Well, in the case of this particular code-base an interesting behaviour appeared later in the code if the product of width and height is sufficiently large and the above function succeeded in allocating memory. That is, the height and width were small enough such that height * v3 was less than 0x7300000 but due to multiplication with other non-constants later in the code may then overflow. The question we then want to answer is, what is the maximum value of image * height that can be achieved that also passes the above check?

Solving Optimisation Problems with Universal Quantification**

This problem is essentially one of optimisation. There are many assignments to the input variables that will pass the overflow check but we are interested in those that maximise the resulting product image and height. Naturally this problem can be solved on paper with relative ease for small code fragments but with longer, more complex code this approach quickly becomes an more attractive.

The first thing to note is that at the line marked as 2 in the above Python code we used a useful new feature of ID, the SmtLib2Exporter***, to dump the model constructed in CVC3 out to a file in SMT-LIB v2 syntax. This is useful for two reasons, firstly we can use a solver other than CVC3, e.g. Z3 which is much faster for most problems, and secondly we can manually modify the formula to include things that our Python wrapper currently doesn’t have, such as universal quantification.

Universal quantification, normally denoted by the symbol ∀ and the dual to existential quantification, is used to apply a predicate to all members of a set. e.g. ∀x ∈ N.P(x) states that for all elements x of the natural numbers some predicate P holds. Assume that the conditions of the integer overflow check are embodied in a function called sat_inputs and M is the set of natural numbers module 2^32 then the formula that we want to check is (sat_inputs(x, y) => (∀ a, b ∈ M | sat_inputs(a, b), x * y >= a * b)), that is that we consider x and y to be solutions if x and y satisfy the conditions of sat_inputs implies that the product x * y is greater or equal to the product of any other two values a and b that also satisfy sat_inputs. This property is encoded in the function is_largest in the following SMT-LIB v2 code. The rest of the code is dumped by the previous Python script so checking this extra condition was less than 5 lines of work for us. The details of sat_inputs has been excluded for brevity. It simply encodes the semantics the integer overflow checking code.


(declare-funs ((img_width BitVec[32])(img_height BitVec[32])))

(define-fun sat_inputs ((img_width BitVec[32])(img_height BitVec[32])) Bool
    (and
         ; Model of the code goes here
    )
)

(define-fun is_largest ((i BitVec[32])(j BitVec[32])) Bool
    (forall ((a BitVec[32]) (b BitVec[32]))
        (implies (sat_inputs a b)
            (bvsge (bvmul i j) (bvmul a b))
        )
    )
)

(assert (and
    (sat_inputs img_width img_height)
    (is_largest img_width img_height)
    )
)

(check-sat)
(get-info model)

Finding the maximum product of height and width

Running this through Z3 takes 270 seconds (using universal quantification results in a significant increase in the problem size) and we are provided with an assignment to the height and width variables that not only pass the checks in the code but are guaranteed to provide a maximal product. The end result is that with the above two inputs height * width is 0x397fffe0, which is guaranteed to be the maximal product, and height * (((width + 31) >> 3) & 0xfffffffc) is 0x72ffffc, as you would expect, which is less than 0x7300000 and therefore satisfies the conditions imposed by the code. Maximising or minimising other variables or products is similarly trivial, although for such a small code snippet not particularly interesting (Even maximising the product of height and width can be done without a solver in your head pretty easily but instructive examples aren’t meant to be rocket science).

This capability becomes far more interesting on larger or more complex functions and code paths. In such cases the ability to use a solver as a vehicle for precisely exploring the state space of a program can mean the difference between spotting a subtle bug and missing out.

Conclusion
By its nature code auditing is about tracking state spaces. The task is to discover those states implied by the code but not considered by the developer. In the same way that one may look at a painting and discover meaning not intended by the artist, an exploit developer will look at a program and discover a shadow-program, not designed or purposefully created, but in existence nonetheless. In places this shadow-program is thick, it is easily discovered, has many entry points and can be easily leveraged to provide exploit primitives. In other places, this shadow-program clings to the intended program and is barely noticeable. An accidental decrement here, an off-by-one bound there. Easy to miss and perhaps adding few states to the true program. It is from these cases that some of the most entertaining exploits derive. From state spaces that are barren and lacking in easily leveragable primitives. Discovering such gateway states, those that move us from the intended program to its more enjoyable twin, is an exercise in precision. This is why it continues to surprise me that we have such little tool support for truly extending our capacity to deal with massive state spaces in a precise fashion.

Of course we have some very useful features for making a program easier to manually analyse, among them HexRays decompiler and IDA’s various features for annotating and shaping a disassembly, as well as plugin architectures for writing your own tools with Immunity Debugger, IDA and others. What we lack is real, machine driven, assistance in determining the state space of a program and, dually, providing reverse engineers with function and basic block level information on how a given chunk of code effects this state space.

While efforts still need to be made to develop and integrate automation technologies into our workflows I hope this post, and the others, have provided some motivation to build tools that not only let us analyse code but that help us deal with the large state spaces underneath.


* As a side note, Z3 solves these constraints in about half a second. We hope to make it our solving backend pretty soon for obvious reasons.
** True optimisation problems in the domain of satisfiability are different and usually fall under the heading of MaxSAT and OptSAT. The former deals with maximising the number of satisfied clauses while the latter assigns weights to clauses and looks for solutions that minimise or maximise the sum of these weights. We are instead dealing with optimisation within the variables of the problem domain. OptSAT might provide interesting solutions for automatic gadget chaining though and is a fun research area.
*** This will be in the next release which should be out soon. If you want it now just drop me a mail.

Thanks to Rolf Rolles for initially pointing out the usefulness of Z3’s support for universal/existential quantification for similar problems.

Validity, Satisfiability and Code Semantics

In a recent post to DD I mentioned some interesting features that will be available in Immunity Debugger 2.0. These features rely on a translation layer from x86 code to SMT formulae that Pablo constructed as part of his work on DEPLIB 2.0. In the past few weeks I got some time to put together a few scripts for ID that replicate some of the more useful tasks that we can use a solver for. In this post I am going to elaborate on one such script which is designed to find ROP gadgets meeting user specified conditions.

find_gadget.py is a relatively simple piece of software which is a testament to Pablo’s API development, the Python programming language and, I think quite importantly, the suitability of mathematical logic for reasoning about machine code. This final point is of course unsurprising but it provides good motivation when considering the merits of abstracting x86 code to more logical/mathematical representations for analysis.

We begin our gadget search by running gadgets.py. Currently this script finds any instruction sequence ending in a ret instruction (with support for pop REG/jmp REG etc. in the works). This takes about 360 seconds to run on QuickTimeAuthoring.qtx (2.16MB) and finds 80,000 candidate gadgets. For now no further analysis is done on these gadgets but we’re working on some fun stuff in that area.

At this point we can use find_gadget.py to search the candidate gadgets for one that meets whatever semantics we have in mind. For now the semantics are specified via the -d, -n and -v/-s options, i.e. DESTINATION RELATION SOURCE/VALUE. For example, to represent EAX <= [EBX+24] we would use -d EAX -n <= -s [EBX+24]. (This is a little cumbersome and not as flexible as one might like so we built a BNF grammar based on pyparsing that allows for arbitrary semantics to be specified as constraints and that should be swapped in pretty soon.) The full set of arguments are shown in this screenshot:

Arguments to find_gadget.py

Once we have specified our arguments the script gets on with the fun part. Our algorithm is as follows:


for gadget in candidiate_gadgets:
    sa = SequenceAnalyzer(reg_model, flag_model, mem_model) # 1
    sa.analyze(gadget.addr, gadget.depth) # 2
    
    if relation == '=':
         rel_expr = sa.solver.eqExpr(dest, src) # 3
    elif relation == '<=':
         ...

    preserve_expr = None
    if preserve_regs != None: # 4
         for reg in preserve_regs:
              eq_expr = sa.solver.eqExpr(sa.regs_before[reg], sa.regs_after[reg])
              preserve_expr = sa.solver.boolAndExpr(preserveExpr, eq_expr)
        rel_expr = sa.solver.boolAndExpr(rel_expr, preserve_expr)

    res = sa.solver.queryFormula(rel_expr) # 5
    if generic_gadgets_only:
         if res == VALID:
              # VALID GADGET FOUND
     else:
          if res == SATISFIABLE:
              # SATISFIABLE GADGET FOUND

#1 Modelling registers, flags and memory
One of the arguments you may have noticed to the script is -c. This argument tells the script that we want to look for ‘context specific’ gadgets that satisfy our semantics when current values in registers, memory and flags are taken into account. The alternative is to look for generic gadgets that will meet the required semantics regardless of the context e.g. inc eax will only set eax to 0 if it previously contained -1 while xor eax, eax will always set it to zero. We’ll discuss this a little more on point #5.

#2 Gadgets to equations
The main coding effort in building this framework was building a transformer for each x86 instruction into the domain of our theorem prover. This requires one to encode accurately the semantics of the instruction over flags, registers and memory and is the backbone of any tool that reasons about assembly code using a solver. This long and drawn out functionality is hidden behind the analyze function which iterates over each instruction and updates the solver state. Once this has completed our solver internally has an accurate representation of the gadgets semantics in the form of several equations.

# 3 & # 4 Adding our gadget constraints
Once one has a representation of a sequence of instructions as equations the next step is typically to append some further constraints derived from the task at hand and then query the solver to determine if they are valid or satisfiable, and if so, to retrieve an input that makes it so. In our case our constraints simply specify a relation between an output register/memory location and an input register/memory location or a constant. We also allow the user to specify a number of registers that the gadget should preserve. We end up with a formula specifying something like (ESP_after == EAX_before+4 AND EBX_after == EBX_before), which is essentially a stack swap with the buffer pointed to by EAX and preserving the EBX register.

# 5 Context specific vs. generic gadgets
After encoding our constraints as a formula in steps #3 and #4 we can then query the solver to determine the status of these constraints in the context of the gadget encoding constructed in step #2. What do we mean by ‘status’? Well, when considering the SAT problem a formula can either be valid, invalid, satisfiable or unsatisfiable. A formula is satisfiable if there exists an assignment to free variables that makes it true and is unsatisfiable otherwise. A formula is valid if its negation is unsatisfiable or invalid otherwise. In other words, a formula is valid if any variable assignment makes it true. Why is this important? If we’re looking for generic gadgets then we want them to meet our constraints regardless of the context, therefore we leave all memory locations, registers and flags free and require that our constraints are VALID in the context of the gadget. That is, there exists no assignment to the memory locations, registers and flags that would result in the gadget not meeting our constraints.

The next few screenshots show some usage examples.

A generic gadget to set EAX to 1

A generic gadget to set EAX to 1 while preserving ESI

Finding multiple gadgets to achieve the same result

find_gadget.py is a very simple script but at the same time can find some very complicated instruction sequences in a short amount of time. In particular it can find tricky stack swapping gadgets and can process about 200,000 gadgets in 3 hours, which is probably a bit quicker than doing it by hand. In some upcoming posts I’ll elaborate a bit more on what can be done with the x86 -> SMT transformer -> solver code. For an idea of some of the things we’re hoping to implement many of the papers published in the last few years on symbolic execution and derived techniques are a good starting point and quite a few are linked from the Practical Software Verification Wiki

Finding use-after-free bugs with static analysis

Earlier this year I had a lot of fun using run-time instrumentation and analysis to tackle a variety of program analysis problems. In doing so I became curious about static solutions to the common problems encountered during dynamic analysis. One of the most obvious issues is that you can only examine those paths that you can execute and thus you need to find some way to drive a program through different paths before you can do any kind of analysis. The flip side of that is that you are guaranteed that any path you analyse is valid and so false positives in that regard are avoided. With those experiences in mind I decided to try my hand at purely static analysis recently (recently as in August, I suck at finding time to document stuff apparently). Static analysis has a large variety of sources of error and annoyances of its own but for certain bug classes it seemed like a purely static approach could find some interesting results with a tolerable level of false positives.

Before I started I considered a few different bug classes in terms of the strengths/weaknesses of static analysis. Certain types of vulnerabilities that depend on the values in registers/memory locations are probably best avoided unless you have the time to either implement a hell of theoretical ideas that can limit the innaccuracy or have the time to sift through thousands of false positives. The bug classes I decided to focus on were those that could generally be reduced to deviations from expected orderings of ‘events’ on a path. Such bug classes include use of memory before initialisation, unchecked use of return values from functions, use after X vulnerabilities (where X is an API call that marks an argument as supposedly unusable e.g. free() or fclose()) and incorrectly ordered sequences of system calls. Eventually I settled on looking for use-after-free vulnerabilities, although the code built to do that works for almost all the mentioned bug classes with a little extending.

(Before continuing I should mention exactly what assumptions and bounds I put on the work I wanted to do. Firstly, I decided to do path insensitive analysis – that is I considered all paths through a control flow graph regardless of whether the path condition is satisfiable or not. To do otherwise would have been extra work and for the vulnerability classes I was considering it didn’t turn out to be a big problem.

Secondly, I decided to do data flow analysis over both registers and memory locations. Some static dataflow analysis (I think binaudit) only considers registers, but in my opinion that misses out on a lot of useful information available at practically zero cost. For instance, if we are doing taint analysis and eax is tainted then after mov [ecx+44], eax; I consider the abstract location denoted by the literal [ecx+44] to also be tainted. It remains in the tainted set until the ecx register is untainted but up until that point it is usable as a source of information.

Thirdly, this project was basically just to give me a taste of the practical side of static analysis so spending a month implementing dataflow analysis for the entire x86 instruction set was out of the question. As a result I implemented the data flow analysis for a small subset of the instruction set I considered to be most relevant to the bug classes considered and wrote a conservative default for all other instructions. That is, for any instructions not specifically considered I make an attempt to guess only their destination operand. The effective result of this is that for such instructions the destination will be removed from whatever analysis I’m doing. This potentially introduces false negatives but also frees up about a month of my life. 😉

Fourthly, when considering loops I only expanded them for one iteration. I haven’t thought too much about the implications of this as there didn’t seem to be a better method without investing time into implementing a bounded loop unwinding technique. It would seem like it might introduce false positives but in my testing I did not encounter anything that could be directly traced back to this weakness. It’s hard to tell if that was due to my small test set, the characteristics of the vulnerabilities I was considering or that my conservative data flow analysis hid the potential false positives.

Fifthly (at this point I’m wishing I’d used 1, 2, 3…), I inititally aimed at intraprocedural analysis and then tacked on some interprocedural fun at the end. I’m quite happy with how my interprocedural hackery worked out but there are probably better (and more time consuming) ways to do it.)

Finding equivalent variables

When doing static analysis you can essentially start at any address that suits the problem at hand. This allows us to divide our algorithm for finding use-after-free bugs into two parts (well three actually, but more about that later). The first part of the algorithm is to decide at a free call what memory locations and registers we want to consider free’d. We want to know all variables that contain pointers to the memory location about to be free’d so that we can consider a use of any of these variables to be a bug.

The most common theoretical framework for this problem is called use-def analysis and is common in compiler theory. In such an analysis we take a variable use (e.g. the push of whatever variable is to be free’d) and compute all its definitions at that point by traversing backwards over all paths to that point. We then want to apply this function recursively over all the definition variables we have found, treating them as uses. By modifying the standard use-def algorithm we can do this to find all variables equivalent to the free’d variable.

In my implementation as I traverse the paths backwards from a free call to find definitions I maintain a list of all locations that are used as destination operands in instructions i.e. they are rewritten before the free call. I will refere to this as the clearedVars list. So, if we are looking for the definition of a variable x and it is found at an instruction mov x, y; we know y is equivalent to the free’d variable if and only if y is not a member of clearedVars. Regardless of whether y is in clearedVars or not we then apply our use-def algorithm to find its definitions with the same considerations. This iterative approach is continued until all paths leading to the free call have been analysed and we are left with a set of variables equivalent to the argument to free.

The following snippet of Python code will hopefully help the explanation. It shows the logic applied to the destination operand of a mov instruction.

if dst in state['needDefList']:
    src = insDataFlow.getSrcFor(dst)
    state['needDefList'].append(src)
                    
    if src not in state['clearedVars']:
        if src not in self.equivVarList:
            self.equivVarList.append(src)
    
    state['needDefList'].remove(dst)
    state['clearedVars'].append(dst)

When finding the set of equivalent variables we can generally avoid many sources of false positives in static analysis by accepting false negatives. The main source of false positives I encountered (that weren’t caused by my lack of coding talent) derived from considering paths with unsatisfiable conditions.

So at this point we have an algorithm for computing a set of equivalent variables given a starting point and a source variable. In case it isn’t obvious, I should point out that the equivalent variables along each path should be stored separately. Otherwise it becomes an avoidable source of false positives in the next part of our algorithm.

Finding use-after-free instances

Most of the work for this algorithm is in the previous stage. Once we have computed the equivalent variables per backwards path we are ready to look for uses of these variables in an unsafe context. We also use the data flow information from each instruction to add/remove variables from the set of locations we consider to hold pointers to free’d memory.

For use-after-free vulnerabilities I considered unsafe use to be any instruction that used the free’d pointer in the computation of a memory address. (I also extended eventually this definition to include any instruction that pushed a free’d pointer to the stack). Checking for such a condition is relatively simple. For each instruction we just iterate over all base registers used in computing the pointer and determine if it is in the set of variables we know to hold free’d pointers or not.

def checkInsForFreeVarUse(self, ea, dst, src, state):
    for op in (dst, src):
        if isinstance(op, TaintLoc_MEMREF_REGS):
            # Usage e.g. mov [ebp+10], eax; and ebp is a free'd var
            for usedReg in op.regs:
                if usedReg in state['freedVars']:
                    self.b00m(ea, usedReg)

In my code the TaintLoc_MEMREF_REGS class represents an operand that is a memory location constructed using at least one register. The objects src and dst are the source and destination operands for a given instruction (a single source and destination suffices for the instructions instrumented in this case).

That is basically the bones of an algorithm that can operate within the bounds of any function containing a call to free; this is useful in its own right but as I thought about it I began to consider cases where a function may free one of its arguments. This could be a problem in two ways: 1) The programmer using the API call is unaware of this functionality, or forgets, or 2) The function should not free the argument and that it does is a flaw in its implementation. The latter case is more interesting in my opinion but the same approach will detect both.

Function aliases and interprocedural analysis

There is probably some other name for what I’m about to describe but let’s call it a ‘function alias’ for now. True interprocedural analysis of a function f containing a call to free would involve relatively complex analysis of the relationship between non-local variables in f and the variables defined at the call sites of f. Doing this properly is non-trivial but we can perform a more limited analysis with much less effort.

The type of interprocedural analysis I implemented begins with searching for aliases to the API call that we are using as the starting point for our algorithms. For use-after-free bugs this is the free function. Let us consider this trigger function as a tuple (f, n), where f is the function in question and n is the argument we consider to be free’d or closed or whatever the action we are interested in happens to be. An alias for a function (f, n) is then a function (g, m) such that calling the function g with the variable x as argument m results in a call to f with x as argument n. If we are provided with one or more aliases for (f, n) we can then apply the exact same analysis algorithm as described in the previous sections to find interprocedural bugs.

The question then becomes how do we build such a list? The answer is pretty simple at a high level – say we are in a function g and analysing a call to the function f that free’s its nth argument. Our first algorithm will build the set of variables equivalent to the nth argument to f, let’s call it E. If any of g‘s arguments are in this set then we know (g, m) is an alias for (f, n) where m is the index of that variable. The only tricky part of this is tracking the function arguments to g. IDA takes care of this for us and renames memory locations automatically using an identifier similar to arg_X but if using another framework you may have to do that yourself. (This turns out to be trickier than you might think, a description of how the simplex method is used in IDA can be found here.)

Righty, so at this point we can take any function and compute its aliases. For maximum fun we apply this recursively to find aliases for aliases and so on, applying our basic analysis algorithms to each discovered alias in turn.

That basically sums up the details of my approach. I used it to look for use-after-free bugs but with varying amounts of effort it could be changed to look for all sorts of fun stuff.

Testing

I tested my implementation (~850 lines of Python using IDAPython as a framework) on libxml2, which has a history of use-after-free bugs, Clam Antivirus, which has a history of sucking and TightVNC, because the name makes me giggle.

The following table summarises the results of my rather brief and unscientific testing.

Analysis results
Analysis results

Both libxml2 and Clam AV came up good for a few bugs each and multiple aliases for free. Some of these aliases were obviously on purpose with names like cl_engine_free, whereas others were more difficult to determine. All three results found in Clam AV were as a result of analysis on an alias function so it is possible that this function has unintended side effects. For libxml2 the bugs were split, two resulting from direct calls to free and two resulting from a call to an alias function. Despite its giggle inducing name, TightVNC showed no bugs and, disappointingly, not even an alias to free. For both libxml2 and Clam AV the false positives were as a result of paths with unsatisfiable conditions.

Conclusion

In the above table I’ve purposely used the term ‘bugs’ instead of ‘vulnerabilities’. The reason for this is the same reason that I’ve now moved on to investigating hybrid dynamic/static implementations. Finding a bug using static analysis of the type I have described gets you a location in a binary where some broken coding idiom occurs. This is useful in its own right and all valid bugs detected during my testing are concrete paths leading to use of a dangling pointer.

From an offensive point of view we must consider the issue further though. Without more analysis you have no idea how to trigger this code or even if it is triggerable in a malicious fashion. In fact, as soon as you get over the initial rush of ‘oh look, a shiney new bug’ you quickly realise you have a mountain of work to actual exercise that code, let alone craft an exploit. From a defensive point of view none of this really matters, the code is incorrect regardless and should be fixed but from an exploit writers point of view discovering the bug in this fashion merely puts your shoes on. You still have a marthon to run in order to get to an exploit.